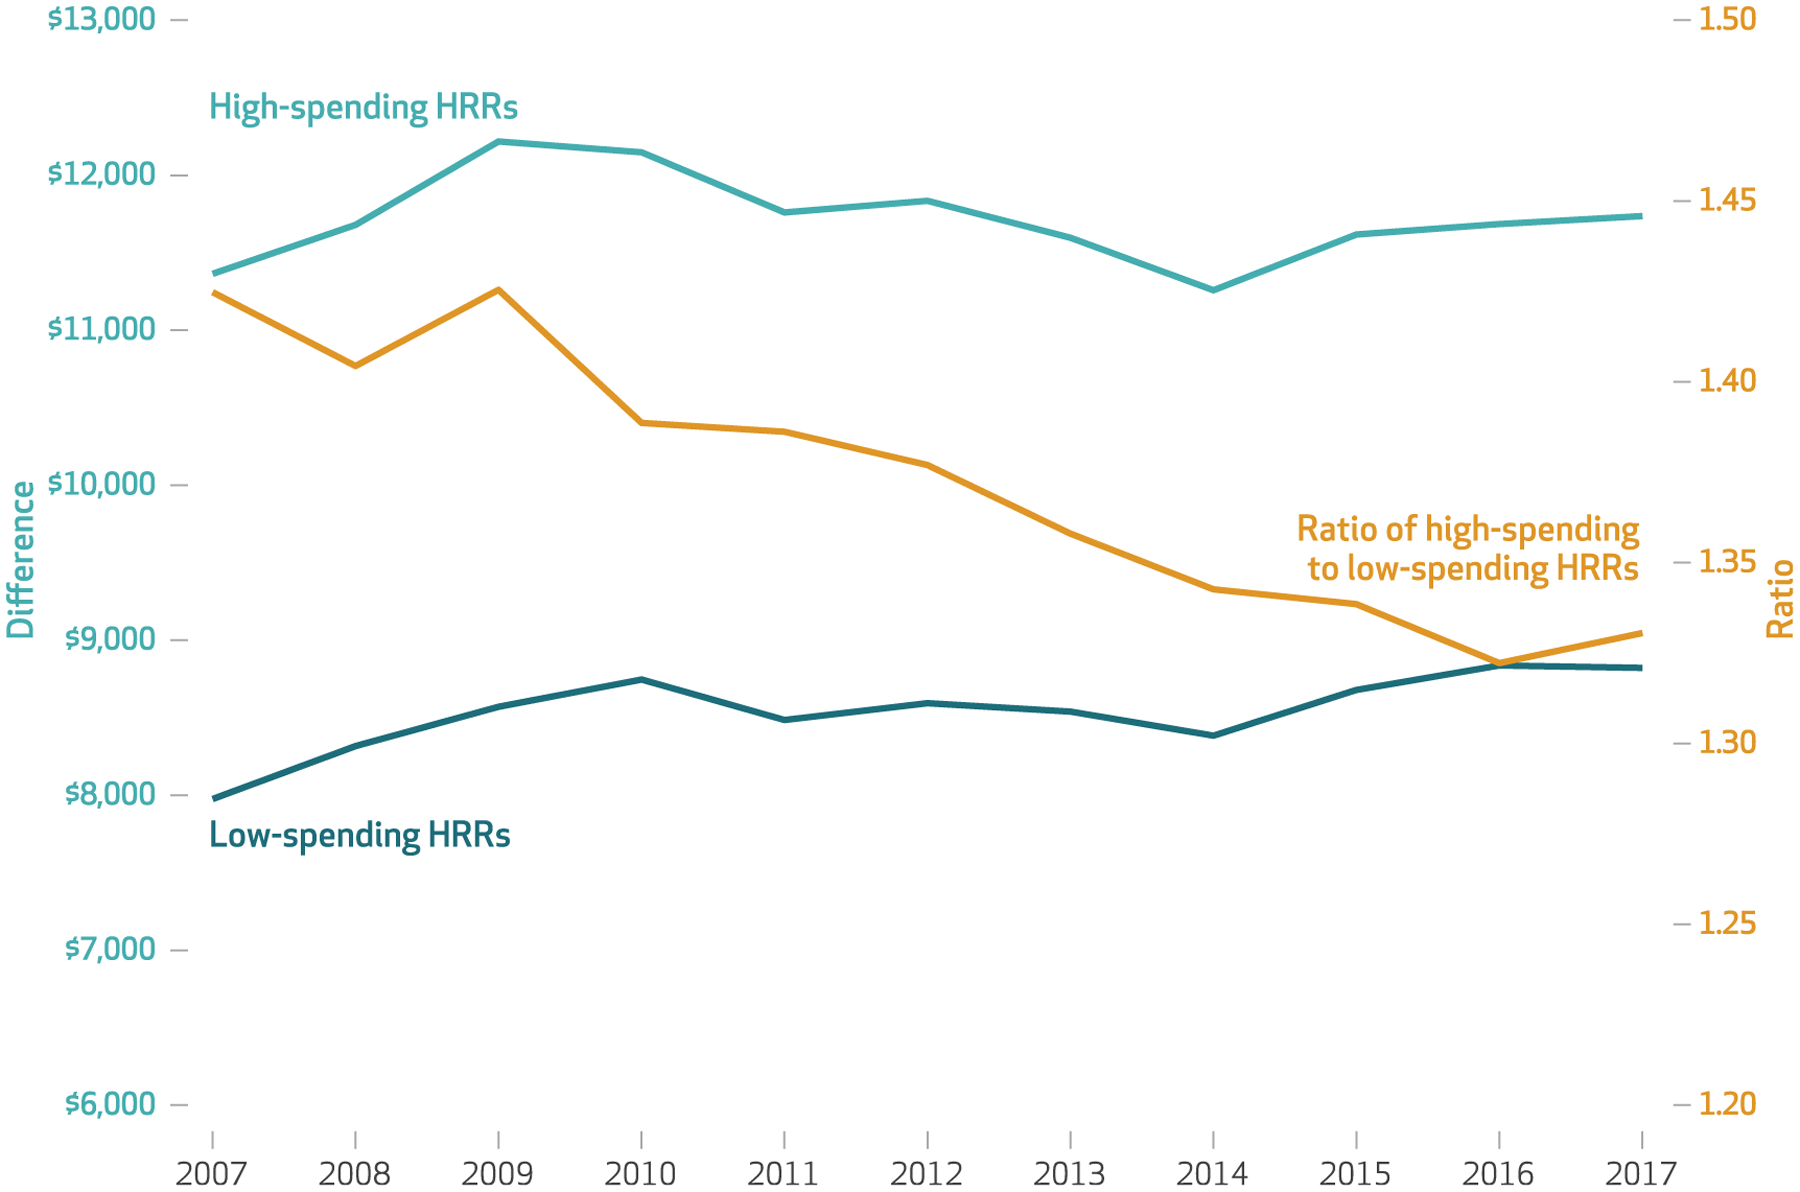
Exhibit 1. Trends in geographic variation in Medicare per capita spending, by hospital referral region (HRR), 2007–17.

SOURCE Authors’ analysis of data for 2007–17 from the Medicare Geographic Variation Public Use File (Centers for Medicare and Medicaid Services). NOTES High-spending HRRs were in the top 10 percent of price- and risk-adjusted total Medicare per capita spending each year, and low-spending HRRs were in the bottom 10 percent.
