
Exhibit 2. Relationship between 2007 and 2017 price- and risk-adjusted Medicare per capita spending, by hospital referral region (HRR).
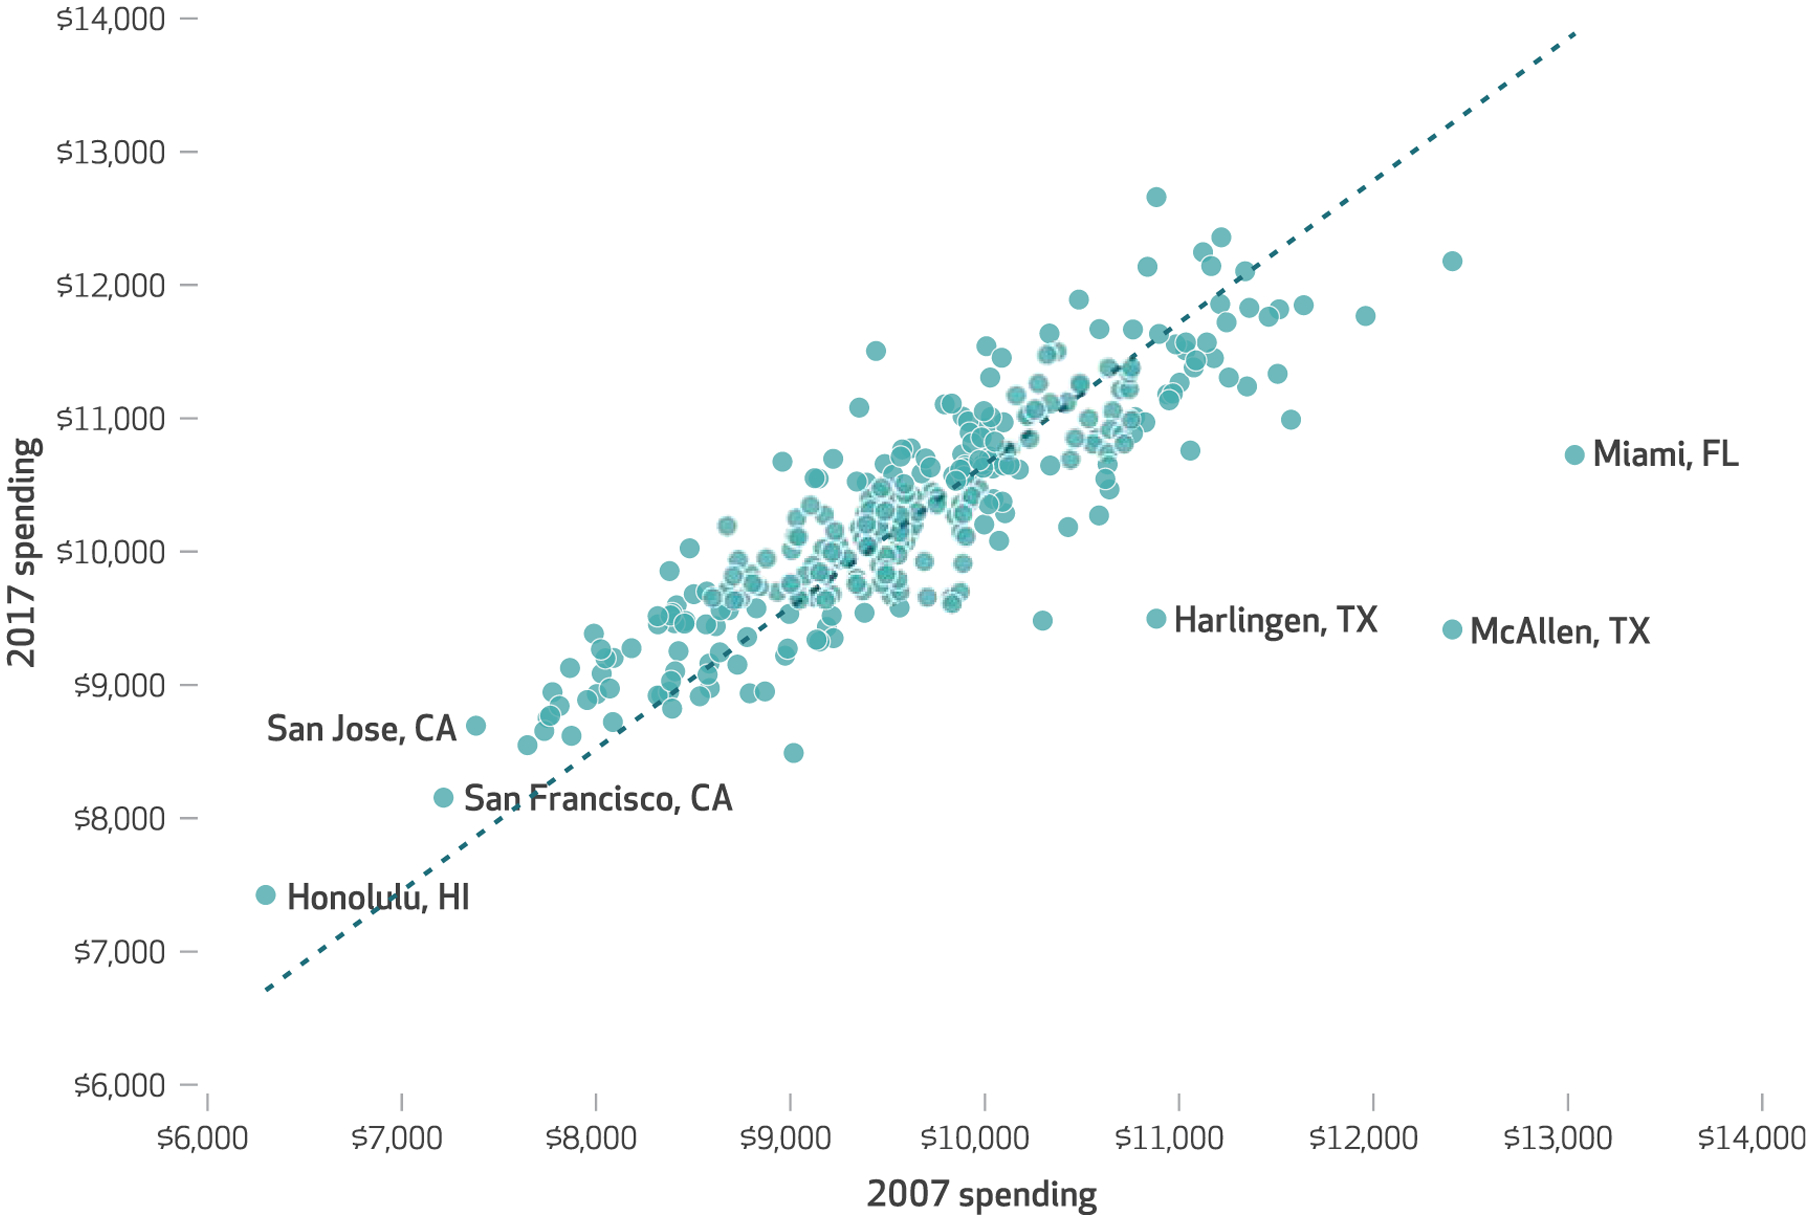
SOURCE Authors’ analysis of data for 2007–17 from the Medicare Geographic Variation Public Use File (Centers for Medicare and Medicaid Services). NOTE Each point in the scatterplot represents an HRR.