
Figure 3.
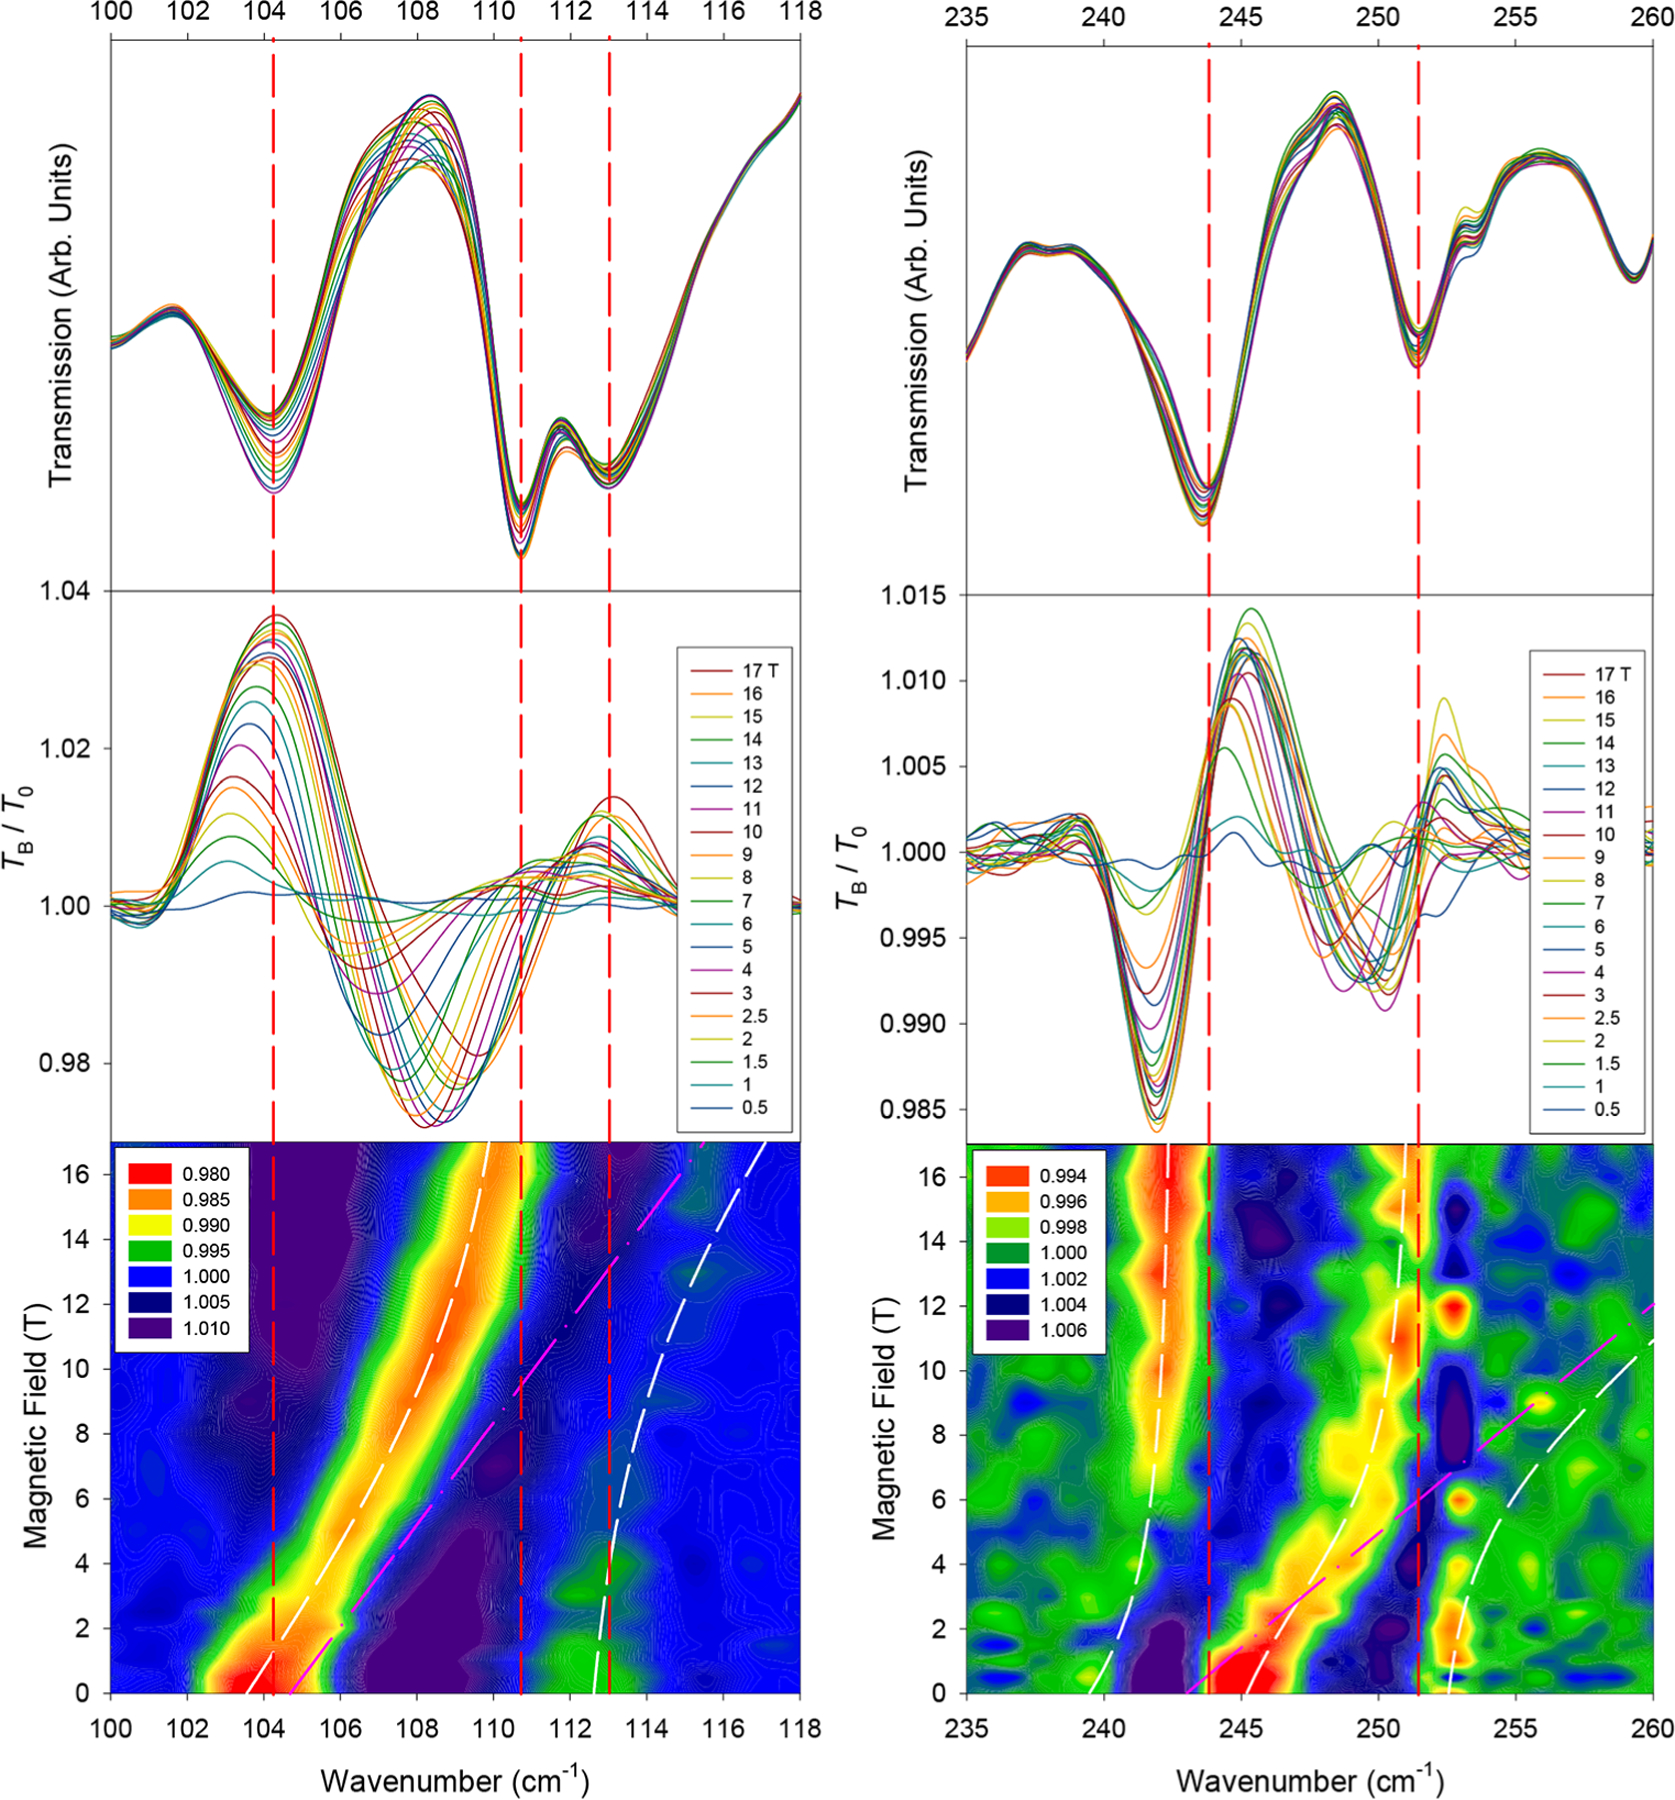
Far-IR spectra in the vicinity of magnetic excitations (left) ν1 and (right) ν3 in a crystal sample of 1. (Top) Raw transmission. (Middle) Transmission (TB) normalized to the zero-field spectrum (T0). (Bottom) Contour plot of the normalized transmission (by average). White lines represent results of the Spin–Phonon coupling fit. Pink lines represent the shift of the uncoupled magnetic peak used for the coupling parameters Esp. Vertical red lines indicate approximate zero-field positions of dominant phonon excitations.