
Figure 5.
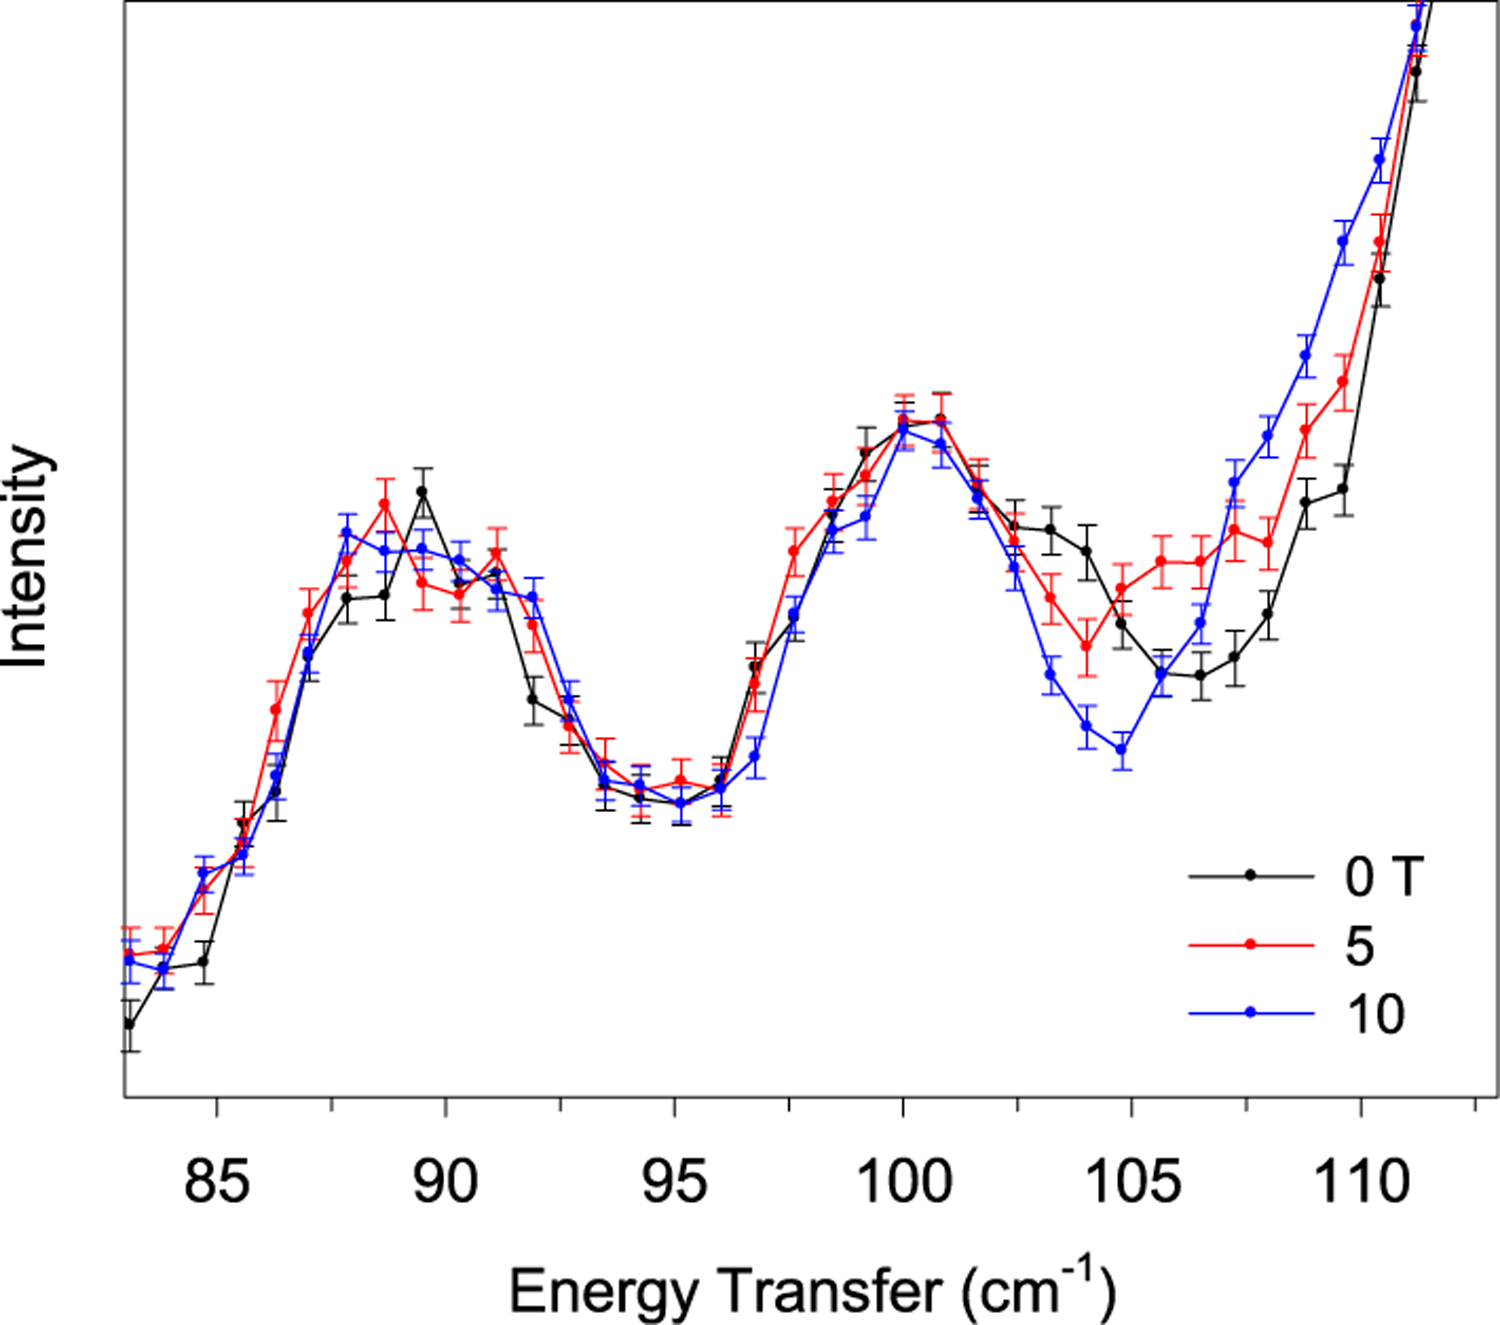
INS spectra (DCS) at 1.7 K at 0 (black), 5 (red), and 10 T (blue). Error bars indicate ±1σ. The spectra in the complete energy transfer range (10–140 cm−1) and a contour plot of the normalized scattering intensity (by average) are given in Figure S9. Unlike the transmittance far-IR spectra in Figures 2 and 3 and Figures S3–S5, the INS peaks in Figures 4–7 are pointed upward.