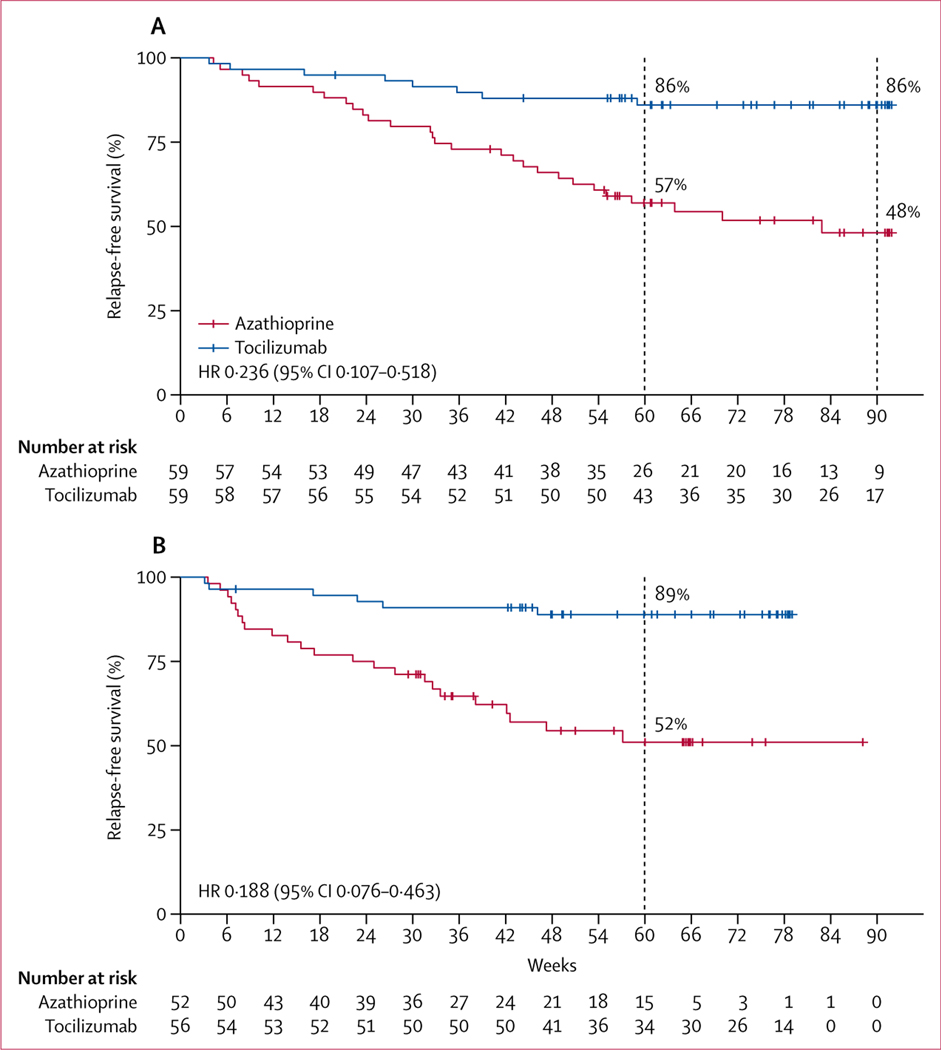
Figure 2: Kaplan-Meier plots of time to first relapse.
(A) Full analysis set. (B) Per-protocol population. Data shown includes censored patients. The minimum planned follow-up period from randomisation was 60 weeks. Patients were censored at first relapse, discontinuation of the study, or when the trial was ended according to the protocol (ie, when at least 30 relapses had occurred), whichever came first. p values were calculated using the log-rank test. Short red and blue vertical lines show censored data.

