Figure 1.

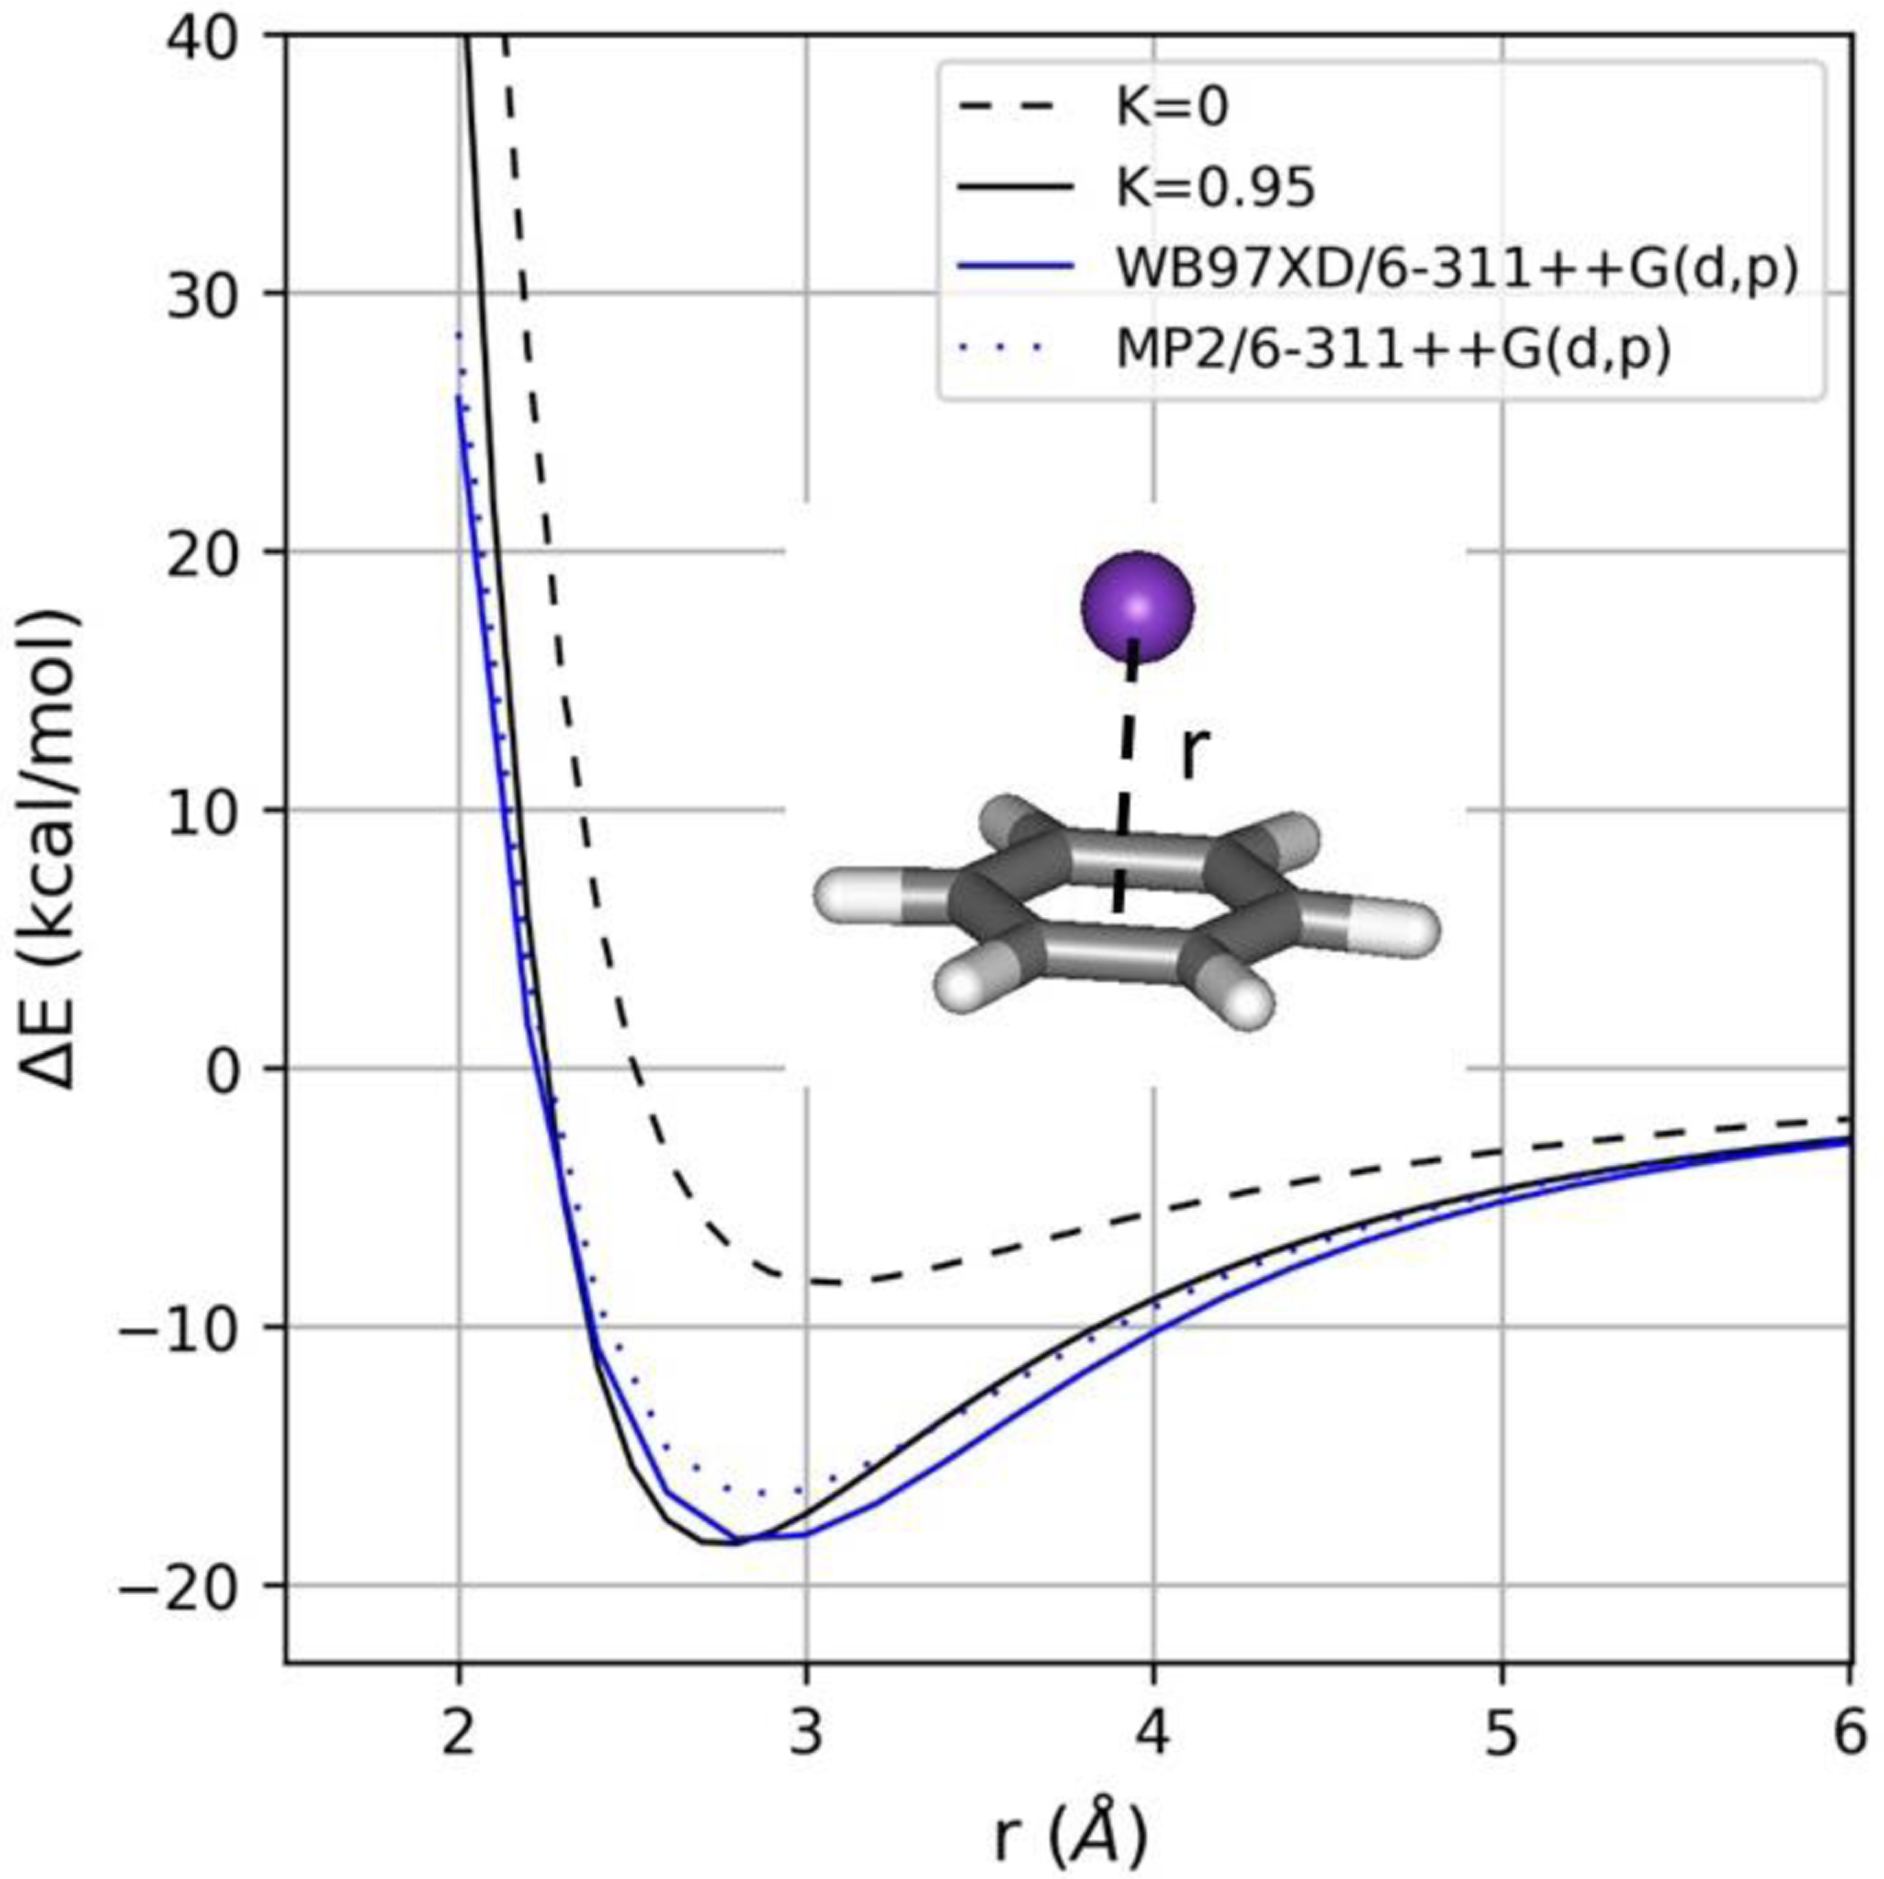
Potential energy curves for separation of the benzene-K+ complex from ωB97X-D/6–311++G(d,p) (solid blue line), MP2/6–311++G(d,p) (blue dots), and OPLS-AA with (solid black line) and without (dashed black line) the 1/r4 cation-π treatment.

Potential energy curves for separation of the benzene-K+ complex from ωB97X-D/6–311++G(d,p) (solid blue line), MP2/6–311++G(d,p) (blue dots), and OPLS-AA with (solid black line) and without (dashed black line) the 1/r4 cation-π treatment.