Figure 1.
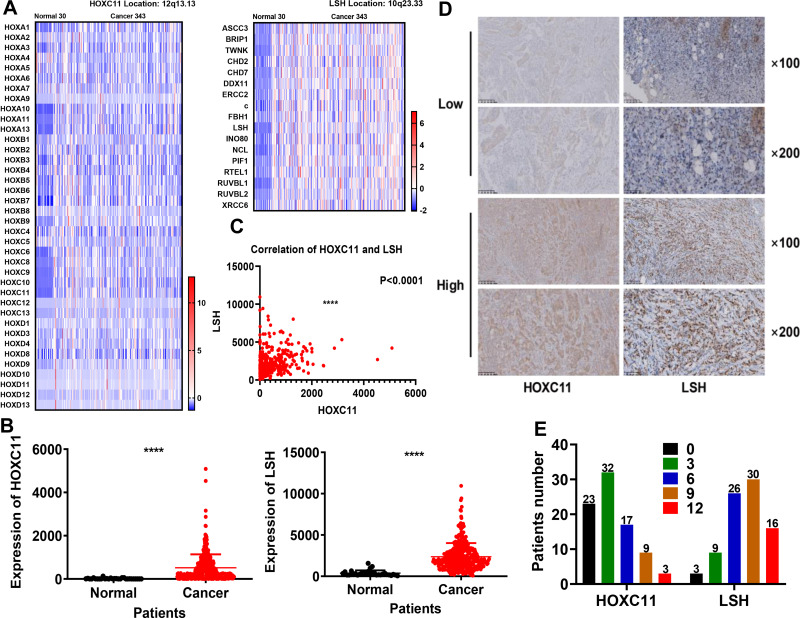
Expression of HOXC11 and LSH in 373 TCGA and 84 clinical GAC samples. (A) Heat map of HOXC11, LSH and related gene expression levels in 373 TCGA samples. (B) Expression level of HOXC11 and LSH in 373 TCGA samples. The expression of HOXC11 and LSH in GAC tissues is higher than that in normal tissues. Shown is the mean ± SD of experiments, ****P < 0.0001. (C) The correlation of HOXC11 and LSH expression in TCGA samples. Shown is the mean ± SD of experiments, ****P < 0.0001. (D) Immunohistochemical staining was used to examine the HOXC11 and LSH protein expression levels in GAC tissues from 84 clinical patients. (E) Distribution of the number of patients in each score for HOXC11 and LSH in 84 clinical GAC samples.

