
FIG: 2.
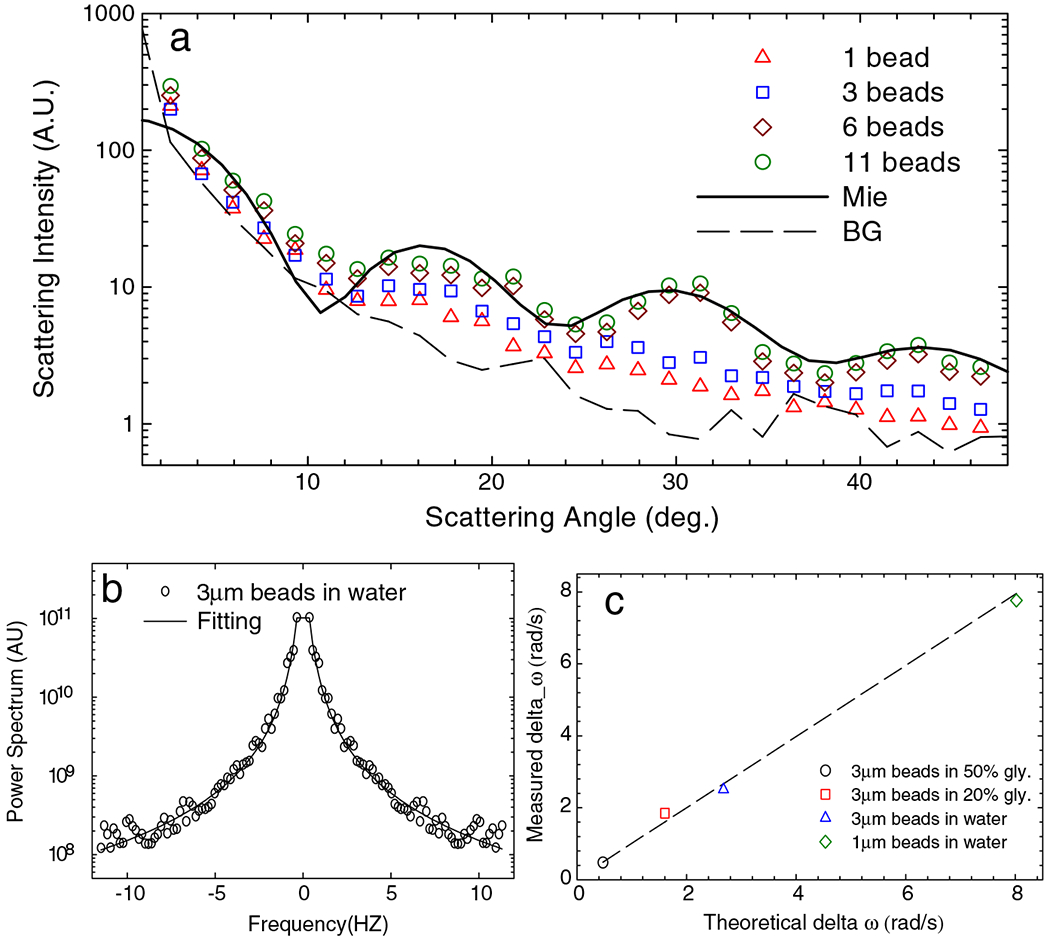
(a) Angular scattering signals associated with 1, 3, 6, and 11 particles, as indicated. The solid line indicates the Mie calculation and the dash line the background signal, measured as described in text. (b) Power spectrum of scattering intensity fluctuations associated with 3 μm particles in water. The solid line indicates the fit with a Lorentzian function. (c) Measured spectral bandwidth vs expected bandwidth for different particles and liquids, as indicated.