
FIG: 3.
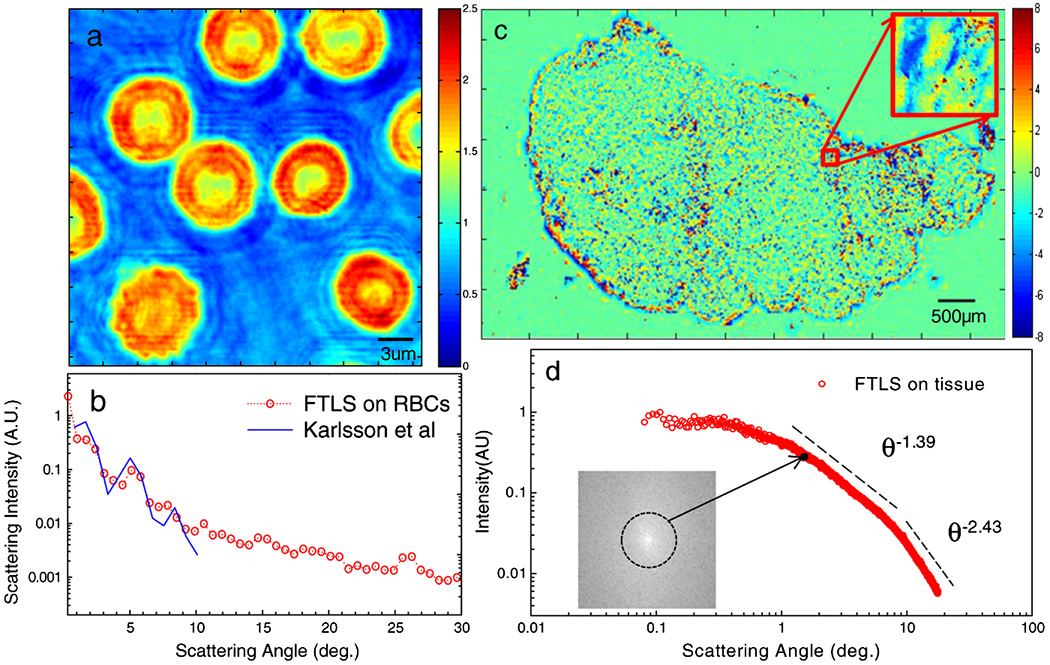
(a) Spatially resolved phase distribution of red blood cells. The color bar indicates phase shift in radians. (b) Scattering phase function associated with the cells in (a). The FDTD simulation by Karlsson et al. is shown for comparison (the x axis of the simulation curve was multiplied by a factor of 532/633, to account for the difference in the calculation wavelength, 633 nm, and that in our experiments, 532 nm). (c) Gigapixel quantitative phase image of a rat mammary tumor tissue slice. Color bar indicates phase shift in radians. (d) Angular scattering from the tissue in (c). The inset shows the 2D scattering map, where the average over each ring corresponds to a point in the angular scattering curve. The dashed lines indicate power laws of different exponents, as indicated.