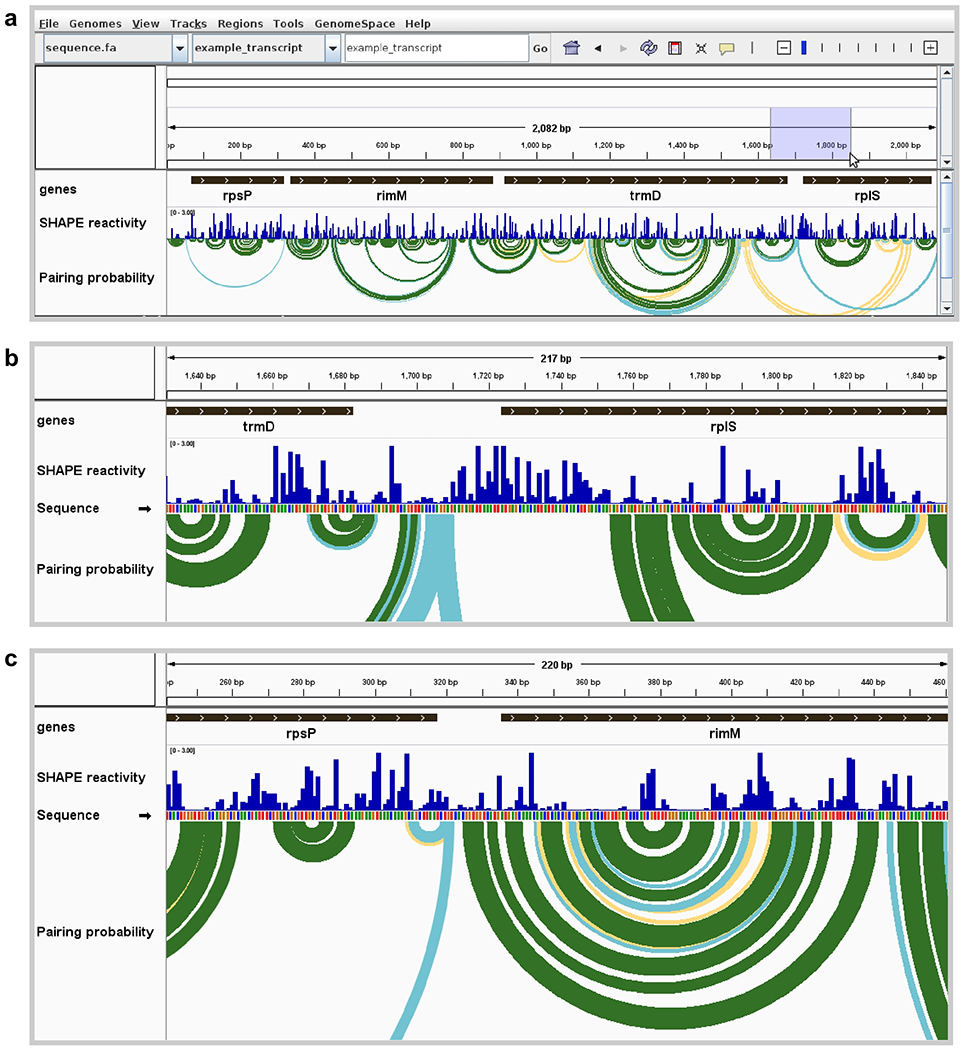
Figure 1. Visualization of E. coli mRNA translation start sites.

(a) Full view of an E. coli polycistronic transcript showing gene boundaries, SHAPE reactivity profile, and modeled base pairing probabilities. Pairing probability is indicated by arc color: green, >80% probability; blue, 30–80%; yellow, 10–30%. High SHAPE reactivities in blue shaded region are indicative of an unstructured region around the rplS translation start site. (b) Zoomed view of unstructured region surrounding the start codon of rplS, showing highly SHAPE-reactive positions modeled as unpaired (corresponding to no arcs indicative of base pairing). (c) Zoomed view of the start codon and surrounding region of rimM, showing positions with low SHAPE reactivities and corresponding well-determined base-pairing structure model. Data from ref. (13).
