
Figure 2. Visualization of structures around AREs in LHR mRNA.
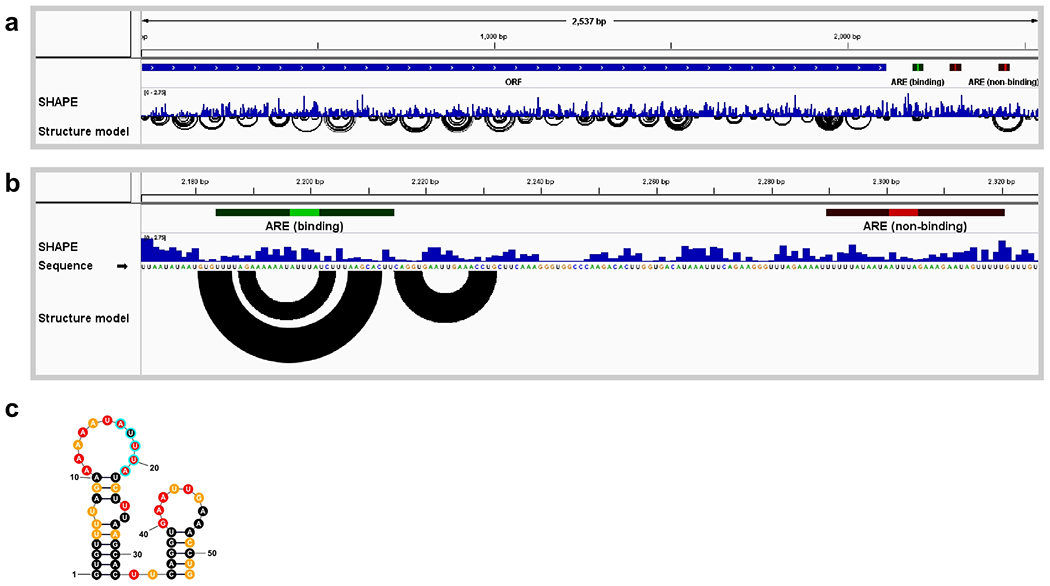
(a) Full view of the LHR transcript showing SHAPE reactivity profile and base-pairing structure model. Annotations include an open reading frame (blue bar labeled ORF) and three AREs (highlighted in green and red). (b) Zoomed view of the region of two AREs, one functional and one non-functional based on binding assays with ZFP36L2 protein(16). The arcs in the Structure model track, which indicate base pairs, suggest that the upstream ARE is highly structured, whereas the downstream ARE is not. (c) ARE structure rendered as a planar graph using the StructureEditor component of RNAstructure. SHAPE reactivities are indicated by color: red, reactivity >0.85; orange, 0.4-0.84; black, <0.4. Core ARE sequence highlighted with cyan outline. Data from ref. (18).