. 2021 Mar 5;10:e60779. doi: 10.7554/eLife.60779

Figure 1. Warm-activated neurons in parabrachial nucleus (PBN) overlap with Pdyn and Penk expression.

(A) Schematized view of PBN regions analyzed for Fos expressing neurons and the genetic cross schemes of Ai14xPdyn-Cre/Ai14xPenk-Cre reporter mouse lines used. (B) Representative images of brain sections harvested from animals exposed to room temperature or 38°C and probed with anti-Fos. Brains from 38°C exposed mice had significantly more neurons in PBN positive for Fos staining. (C) Quantification of Fos positive LPBN neurons per brain. Data are presented as mean ± SEM; n = 4 animals in room temp group, n = 8 animals in warm exposed group; t-test, ∗∗p<0.01. (D) Representative images of Fos labeling (cyan) in Ai14 x Pdyn-Cre brains with Fos labeling of Pdyn+ (red) (filled arrows) neurons and Pdyn- (open arrows). (E) Representative images of Fos labeling in Ai14xPenk-Cre brains with Fos labeling of Penk+ (magenta) (filled arrows) and Penk- neurons (open arrows). (F and G) Quantification of the overlap of Fos staining in Ai14xPdyn-Cre and Ai14xPenk-Cre brains demonstrated 81% or 46% of Fos cells were also overlapped with tdTomato expression in Ai14xPdyn-Cre or Ai14xPenk-Cre brains, respectively.

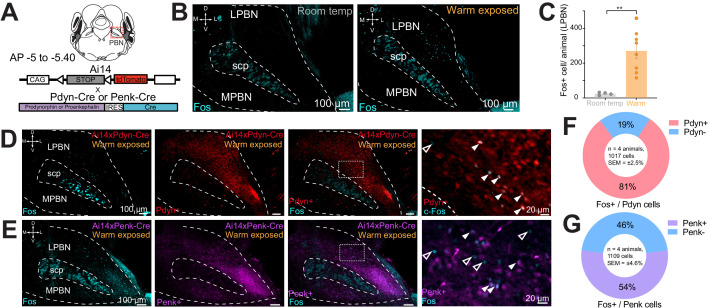
Figure 1.

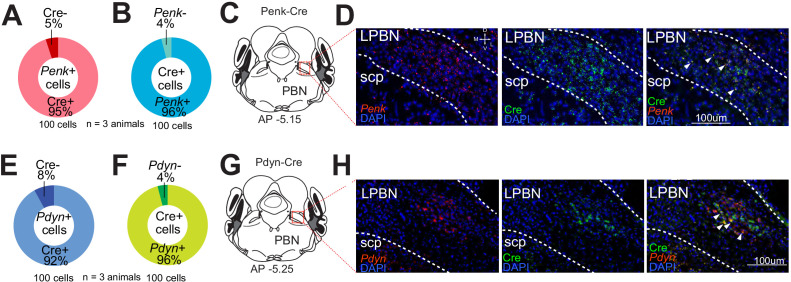
Figure 1—figure supplement 1. Validation of Penk-Cre and Pdyn-Cre lines in the parabrachial nucleus (PBN).

Figure 1—figure supplement 1.

FISH was performed on brain sections from Pdyn-Cre or Penk-Cre mice using probes for prodynorphin or proenkephalin in combination with a probe for Cre transcripts. (A and B) The co-expression of Cre with proenkephalin was quantified by counting 100 cells from three animals positive for labeling of either (A) proenkephalin or (B) Cre and then counting the number of those cells that were also positive for the other probe. (C) Diagram of the anatomic localization of the PBN sections shown in (D) with labeling of proenkephalin (red), Cre (green) and DAPI (blue). Arrowheads highlight examples of cells labeled by probes for both transcripts. (E and F) The co-expression of Cre with prodynorphin was quantified by counting 100 cells from three animals positive for labeling of either (E) prodynorphin or (F) Cre and then counting the number of those cells that were also positive for the other probe. (G) Diagram of the anatomic localization of the PBN sections shown in (H) with labeling for prodynorphin (red), Cre (green) and DAPI (blue). Arrowheads highlight examples of cells labeled by probes for both transcripts.