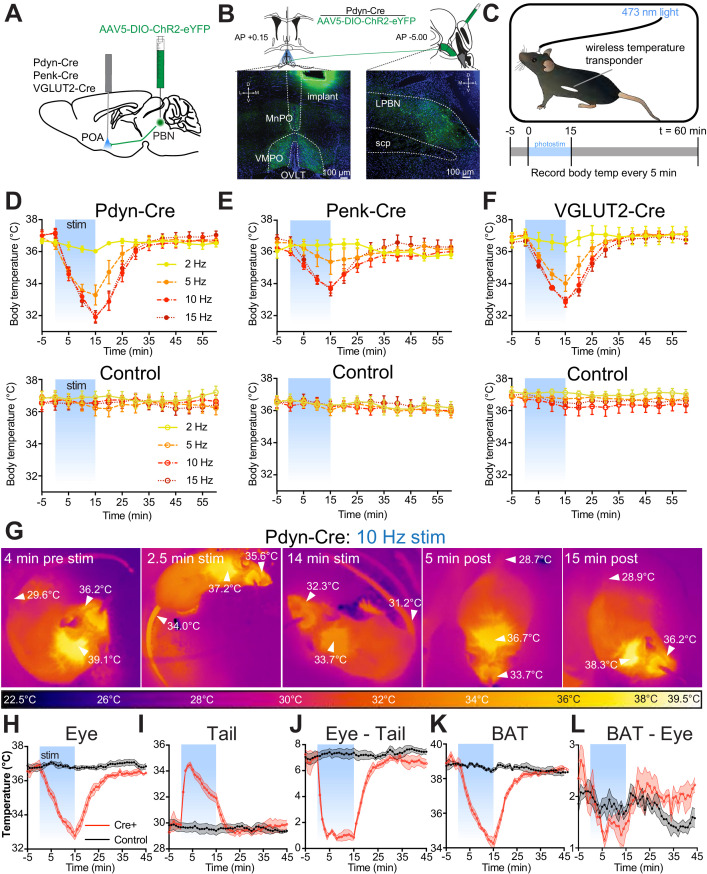
Figure 4. Photostimulation of PdynPBN→POA, PenkPBN→POA, and VGLUT2PBN→POA causes acute hypothermia by evoking thermal heat defenses.
(A) Illustration of viral injections in parabrachial nucleus (PBN) and fiber optic implantation over POA in Pdyn-Cre, Penk-Cre, or VGLUT2-Cre mice. (B) Illustration shows viral and fiber optic delivery in a Pdyn-Cre mouse along with representative expression of ChR2-eYFP (green) in PBN injection site and POA implantation site. (C) Diagram shows core body temperature measurement method and paradigm for photostimulation for 15 min and temperature recording for 65 min trials. (D–F) Body temperature vs. time graphs for 2 (yellow), 5 (orange), 10 (red), and 15 (dark red) Hz photostimulation of (D) PdynPBN→POA, (E) PenkPBN→POA, (F) VGLUT2PBN→POA, and controls for each. Photostimulation was delivered from t = 0 to t = 15 min and led to a frequency dependent reduction in body temperature in Pdyn-Cre, Penk-Cre, and VGLUT2-Cre mice. Body temperature of control animals was stable throughout the trials. Data are presented as mean ± SEM. For experimental animals, n = 6 (D and E) and n = 8 (F). For control animals, n = 8 (D) and n = 7 (E and F). (G) Representative quantitative thermal imaging from a representative trial showing a mouse before, during, and after 10 Hz photostimulation of PdynPBN→POA. Arrows show temperatures of eye, BAT, or tail. Eye and BAT temperature decreased as a result of stimulation; tail temperature increased as a result of stimulation. (H–L) Quantitative thermal imaging measurements of (H) eye, (I) tail, (J) eye minus tail, (K) BAT, and (L) BAT minus eye temperature vs. time graphs for 10 Hz photostimulation of PdynPBN→POA. Photostimulation was delivered from t = 0 to t = 15 min and led to decreases in eye and BAT temperatures, an increase in tail temperature. Tail and eye temperatures equilibrated in Cre+ animals. BAT thermogenesis was suppressed with a decline in the difference between eye and BAT temperatures during stimulation. Data are presented as mean ± SEM. See Figure 4—figure supplement 1 for data from Penk-Cre animals.


