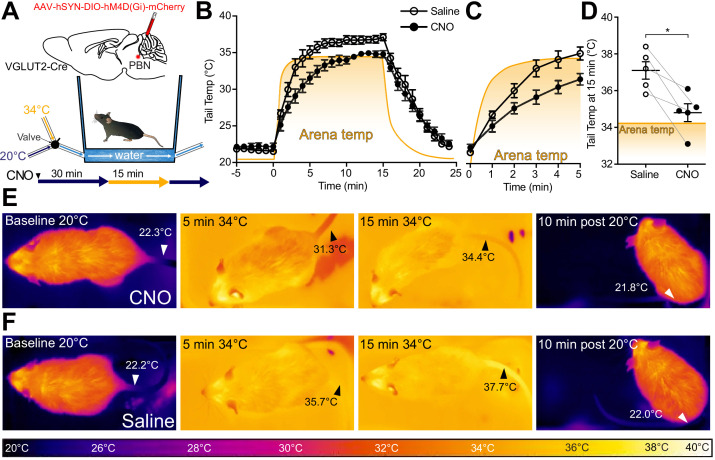
Figure 5. VGLUT2+ parabrachial nucleus (PBN) neurons are necessary for heat-defensive tail vasodilation.
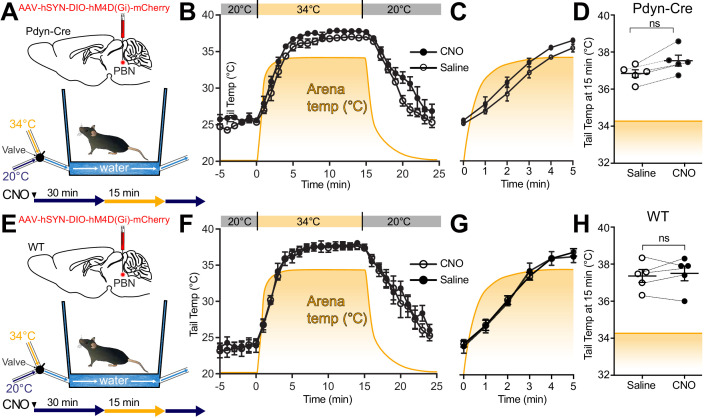
(A) Illustrations depict viral injections in VGLUT2-Cre mice and purpose-built heat challenge arena that allowed for rapid changing of environmental temperature between two stable set points. (B) Tail temperature as determined using quantitative thermal imaging vs. time graph for 34°C thermal heat challenge for mice expressing hM4D(Gi) DREADDs in VGLUT2+ PBN neurons treated either with CNO or saline. Heat challenge was delivered from t = 0 to t = 15 min, and arena temperature measured using thermal imaging during the trial is represented by the orange line. In mice injected with CNO 2.5 mg/kg, tail temperature passively equilibrated with arena temperature (34°C) over the 15 min heat challenge. In mice injected with saline, tail temperature rose above arena temperature after 5 min of heat challenge representing heat release through vasodilation. Data are presented as mean ± SEM. n = 5 animals, paired between CNO and saline conditions. (C) Tail temperature vs. time graph for 34°C heat challenge between t = 0 and t = 5 min. Note the separation between average tail temperatures of the saline condition vs. the CNO condition. Data are presented as mean ± SEM. n = 5 animals, paired between CNO and saline conditions. (D) Tail temperature at t = 15 min of 34°C heat challenge. Tail temperatures in the saline condition were an average of 2.3 ± 0.68°C higher than those in the CNO condition. (E) Representative thermal images of trials for mice treated with CNO and measurement of tail temperature showing tail temperatures remain close to the temperature of the area floor. (F) Representative thermal images of trials for mice treated with saline and tail temperature exceed floor temperature. Data are presented as mean ± SEM. n = 5 animals, paired between CNO and saline conditions. Student’s t-test, ∗p<0.05. See Figure 5—figure supplement 1 for data from the same assay in Pdyn-Cre mice.


