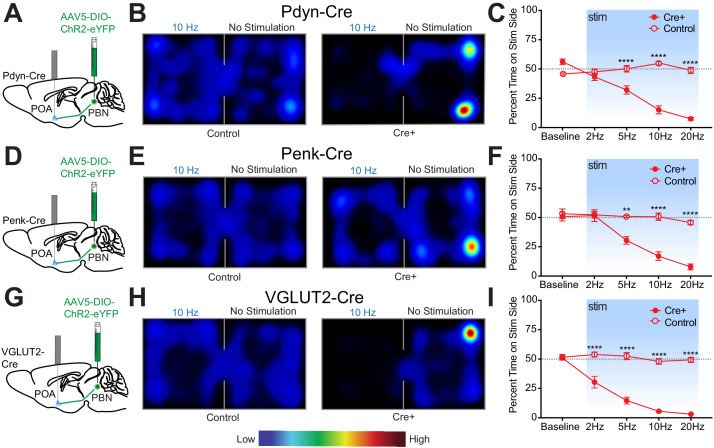
Figure 6. Photostimulation of PdynPBN→POA, PenkPBN→POA, and VGLUT2PBN→POA terminals induces real time place aversion.
(A, D, and G) Illustrations of viral injections in parabrachial nucleus (PBN) and fiber optic implantations over POA in Pdyn-Cre mice, Penk-Cre, and VGLUT2-Cre mice, respectively. (B, E, and H) Representative heat maps showing spatial distribution of time-spent behavior resulting from side-conditional 10 Hz photostimulation of control or Pdyn-Cre, Penk-Cre, and VGLUT2-Cre mice, respectively. (C) For Pdyn-Cre vs control mice, frequency response of RTPP at 0 (baseline), 2, 5, 10, and 20 Hz. Data are presented as mean ± SEM; n = 6 Cre+, eight control; two-Way ANOVA, Bonferroni post hoc. (F) Penk-Cre frequency response of RTPP at 0 (baseline), 2, 5, 10, and 20 Hz. Data are presented as mean ± SEM; n = 6 Cre+, seven control; two-Way ANOVA, Bonferroni post hoc (5 Hz ChR2 vs. 5 Hz control ∗∗∗p<0.001, 10 Hz ChR2 vs. 10 Hz control ∗∗∗∗p<0.0001, 20 Hz ChR2 vs. 20 Hz control ∗∗∗∗p<0.0001). (I) VGLUT2-Cre frequency response of RTPP at 0 (baseline), 2, 5, 10, and 20 Hz. Data are presented as mean ± SEM; n = 8 Cre+, seven control; two-Way ANOVA, Bonferroni post hoc (2 Hz ChR2 vs. 20 Hz control ∗∗∗∗p<0.0001, 5 Hz ChR2 vs. 5 Hz control ∗∗∗∗p<0.0001, 10 Hz ChR2 vs. 10 Hz control ∗∗∗∗p<0.0001, 20 Hz ChR2 vs. 20 Hz control ∗∗∗∗p<0.0001). See also Figure 6—figure supplement 1.


