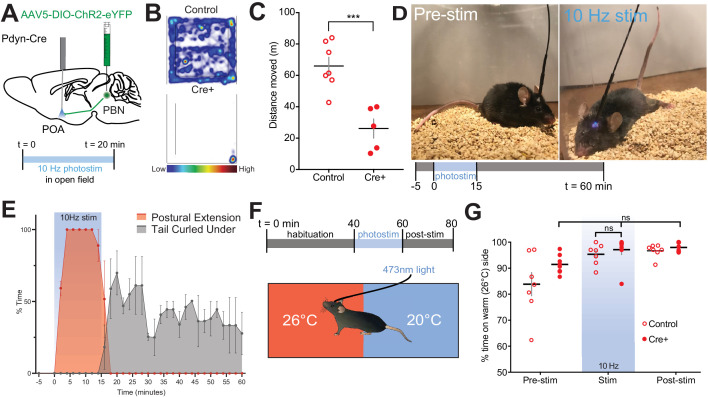
Figure 7. Photostimulation of PdynPBN→POA suppresses locomotion, evokes postural extension but does not alter temperature preference.
(A) Illustration of injection in parabrachial nucleus (PBN) and fiber implantation over POA in Pdyn-Cre mice. (B) Representative heat maps show spatial distribution of time-spent behavior resulting from constant 20 min 10 Hz photostimulation of control or PdynPBN→POA. (C) Quantification of movement during open field testing. Control animals moved an average of 39.84 ± 8.33 meters more than Cre+ animals during open field trials. Data are presented as mean ± SEM; n = 5 Cre+, seven control; Student’s t test, ∗∗∗p<0.001 (D) 10 Hz photostimulation of PdynPBN→POA leads to postural extension behavior as shown. Representative images of a mouse pre stimulation and during 10 Hz photostimulation of PdynPBN→POA. (E) Quantification of percent time spent in time spent engaged in postural extension in Pdyn-Cre mice in two min time bins. Following onset of photostimulation mice engaged in postural extension (red). With termination of stimulation mice, we noted to switch to a posture with their tails curled under their bodies (grey). Postural extension was not observed in any control mice. (F) Overview of paradigm with three epochs: 40 min of pre-stim, 10 Hz photostimulation for 20 min, and post-stim for 20 min in an arena with aluminum floor held at 20°C and 26°C on opposing sides. (G) Quantification of time spent in each temperature area showed non-significant changes in percent time spent in each area during delivery of stimulation, with a strong preference for the 26°C side during all epochs. Data presented as mean ± SEM with individual values, n = 9 Pdyn-Cre (ANOVA ns = 0.7341 for Pdyn-Cre mice across epochs) and (t-test ns p>0.99 for Pdyn-Cre vs Control during stimulation epoch).

