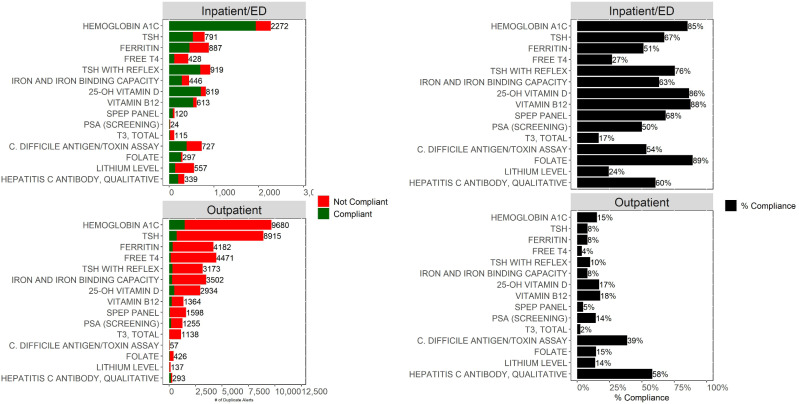
Figure 2.
Shown are the total number of duplicate alerts by test for outpatient encounters (bottom left) and inpatient/ED encounters (top left). Bar colors indicate whether the clinician was compliant with the alert (did not proceed with the order) or was noncompliant. Percent compliance for outpatient (bottom right) and inpatient/ED encounter (top right) represents the proportion of alerts for which the clinician did not proceed with the order. This analysis demonstrates that most duplicate alerts are displayed on outpatient encounters; moreover, alerts displayed on outpatient encounters have a much lower compliance rate. The tests included in this figure represent the 15 tests with the most duplicate alerts across both inpatient/ED and outpatient encounters. ED: emergency department.

