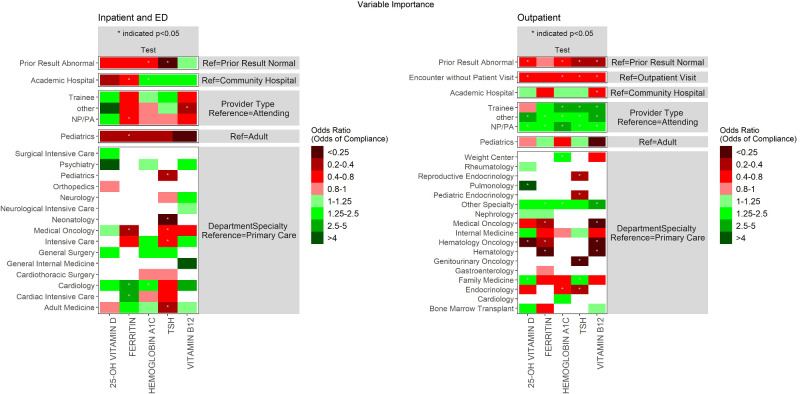
Figure 3.
Shown are odds ratios for each predictor variable based on logistic regression models (separate models trained for each test). Cell colors indicate the odds ratio; shades of green indicate the predictor is associated with greater alert compliance (in comparison to the reference level shown to the right), while shades of red indicate associations with lower compliance. White cells indicate that the specified predictor category was not represented in enough alerts to be included in the model.

