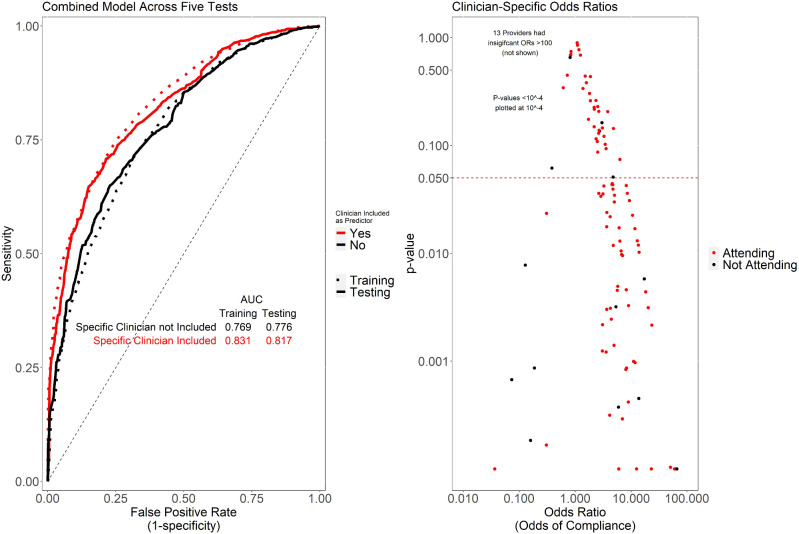
Figure 4.
Shown (left) are ROC curves for logistic regression models. The base model (“provider-independent model”) includes as predictors general characteristics of the order setting, prior result, department and specialty, paralleling the predictors included in the previously described models. The provider-specific also includes as predictors the specific clinician seeing the alert, for all providers seeing at least 20 alerts. The provider-specific model outperformed the base model on independent test data, suggesting the likelihood of difference between individual providers in alert compliance patterns, even after adjusting for other factors. Shown (right) are the provider-specific odds ratios and corresponding P-values for individual providers.

