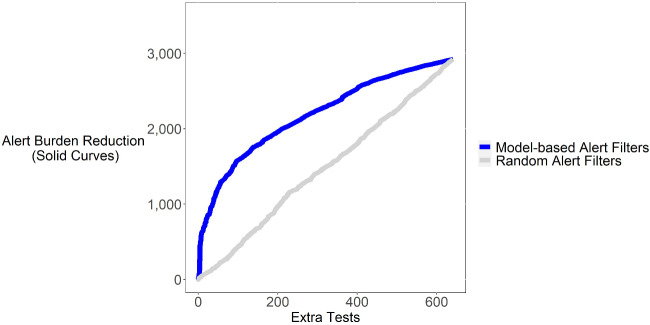
Figure 5.
Shown is a plot of the alert burden reduction that could have been achieved by using the provider-specific model to determine whether to fire alerts in relation to additional tests that would have been performed. Paralleling the ROC curve, this analysis assumes alerts would only be fired if the predicted likelihood of compliance exceeded a specified cutoff threshold; we constructed the curve shown by varying the cutoff threshold. For example, if we were to set the sensitivity/specificity of the model to eliminate 1900 alerts (y-axis), this would be expected to result in few than 200 (x-axis) additional tests being ordered. For comparison, we show a similar curve for a model that uses a random number generator to decide whether to fire an alert. The random number model (negative control) as expected achieves poor performance in comparison to the trained model.

