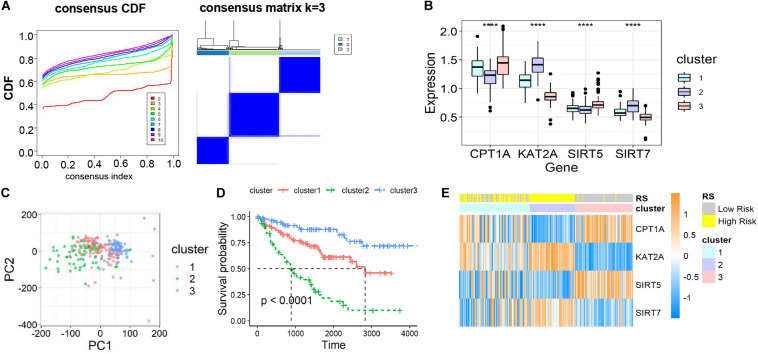
FIGURE 3.
Identification and characteristic description of the consensus clusters based on succinylation regulators in dataset 1. (A) Consensus clustering CDF for k = 2 to 10 and consensus clustering matrix for k = 3. (B) The different expression pattern of four succinylation regulators in three clusters at mRNA level, ****P < 0.0001. (C) PCA of the total mRNA expression profile in dataset 1. (D) Kaplan-Meier survival curve for ccRCC patients in different clusters. (E) The heatmap demonstrated the expression of four succinylation regulators in patients contained in dataset 1 as well as the association between RS and consensus clusters. CDF, cumulative distribution function; PCA, principal component analysis.

