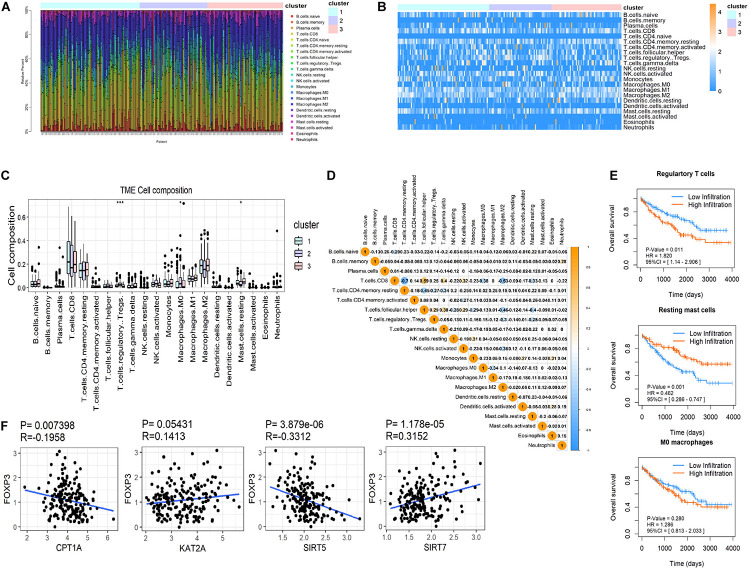
FIGURE 5.
Immune infiltration in ccRCC among the three clusters. (A,B) Both the stacked column chart (A) and the heatmap (B) exhibited the proportion of 22 immune cells in 186 patients screened by CIBERSORT with a significant P-value (P < 0.05). (C) The infiltration pattern of immune cells (except for CD4 naive T cells) in different clusters, *P < 0.05 and ***P < 0.001. (D) Spearman correlation analysis of the 21 immune cells in 186 ccRCC patients. (E) Kaplan-Meier survival curves for patients with differently infiltrated Tregs, resting mast cells and M0 macrophages, respectively. (F) The Spearman correlation analysis between the expression of FOXP3 and the four succinylation regulators.

