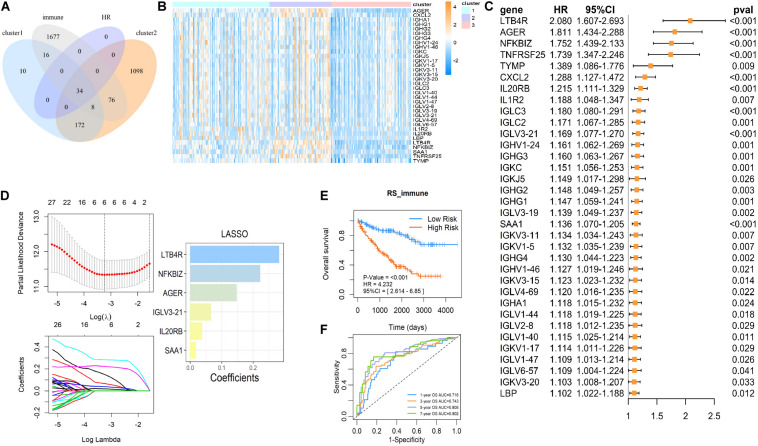
FIGURE 6.
The immune signature based on succinylation modification. (A) The Venn diagram showed 34 candidates contained in up-regulated genes in cluster 2 relative to cluster 3, up-regulated genes in cluster 1 relative to cluster 3 and the immune gene list form Immport Shared Data website at the same time, and all have a significant HR > 1 (P < 0.05). (B) The heatmap displayed relative mRNA expression of 34 candidate immune genes in three clusters. (C) Univariate Cox regression analysis of the association between the mRNA expression of 34 candidate immune genes and OS of patients with ccRCC in dataset 1. (D) The coefficients of important prognosis prediction factors calculated by multivariate Cox regression using LASSO. (E) Kaplan-Meier survival curves for patients with high and low RS based on immune signature. (F) The ROC curves based on immune signature for 1-, 3-, 5-, and 7-year survival probabilities. LASSO, least absolute shrinkage and selection operator.

