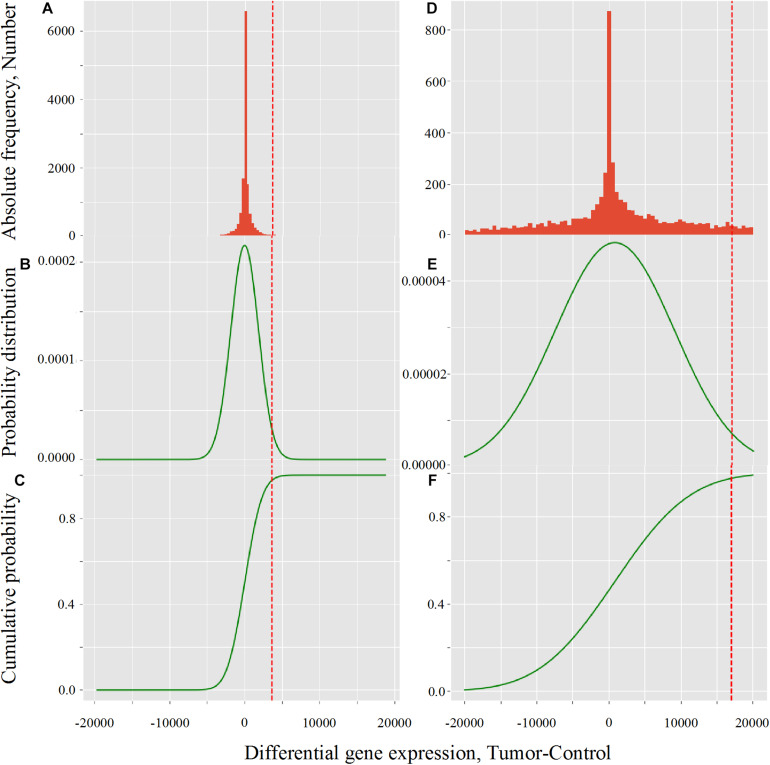
FIGURE 4.
Critical value calculation (red dot line) by CVC script in TCGA (A–C) and GDC (D–F) in LUSC (TCGA-22-4593 sample). (A,D) Histogram of observed differential gene expression distribution (tumor-control) of genes. (B,E) Function of density of probability. (C,F) Function of cumulated probability. The critical values were 3,633.8 and 17,042.9 for TCGA and GDC, respectively.

