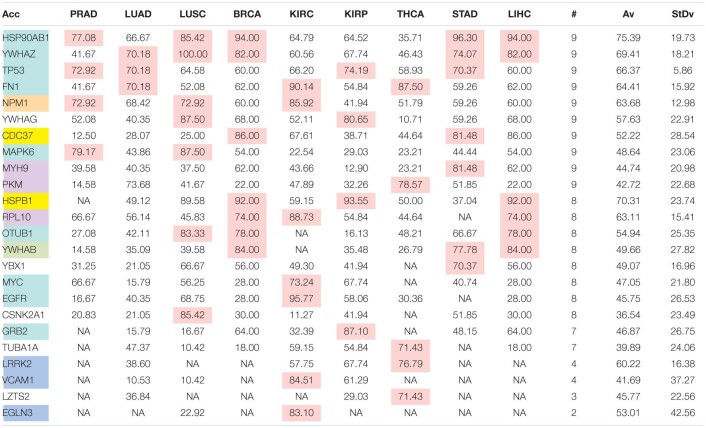
TABLE 6E.
Pattern of distribution for the most relevant targets among solid tumors of nine cancer types according to successive processing through RPKMupper and Log2 normalization.
The numbers in the table represent the proportion (%) of tumors of a given cancer type that showed the gene among the top-20 most connected proteins of the subnetwork of up-regulated genes. The pink color concerns up-regulated genes in at least 70% of tumor samples of each cancer type.

