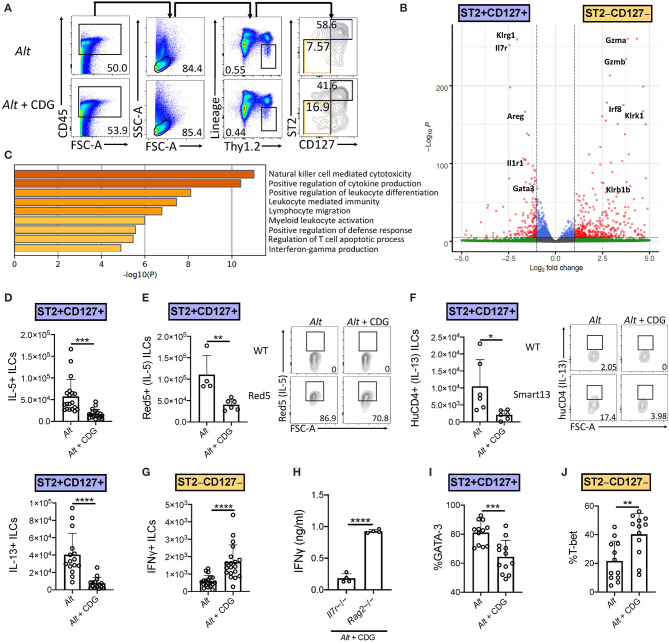
Figure 2.
CDG induces ILC2 to ILC1 compartmental changes. Mice were challenged using the same model as in Figure 1A. (A) Flow cytometric gating scheme for identification of lung ILC2s and ILC1s in Alt and Alt plus CDG challenged mice. (B) RNAseq volcano plot of differentially expressed genes between Alt challenged lung ST2+CD127+ ILCs and ST2–CD127– ILCs. (C) Differentially expressed gene ontology pathways in ST2+CD127+ and ST2–CD127– ILC subpopulations. (D) Total number of IL-5+ (top) and IL-13+ (bottom) lung ILC2s following PMA/ionomycin stimulation ex vivo. (E) Total number of Red5+ (IL-5+) lung ILC2s (left) and representative flow plots (right). (F) Total number of HuCD4+ (IL-13+) lung ILC2s (left) and representative flow plots (right). (G) Total number of IFNγ+ lung ILC1s following PMA/ionomycin stimulation ex vivo. (H) Il7r-/- and Rag2-/- BAL IFNγ ELISA. Frequency of GATA-3+ lung ILC2s (I) and T-bet+ lung ILC1s (J). Data shown are representative of 2–7 independent experiments with 2–4 mice per group. *P < 0.05, **P < 0.01, ***P < 0.001, ****P < 0.0001, unpaired t-test.

