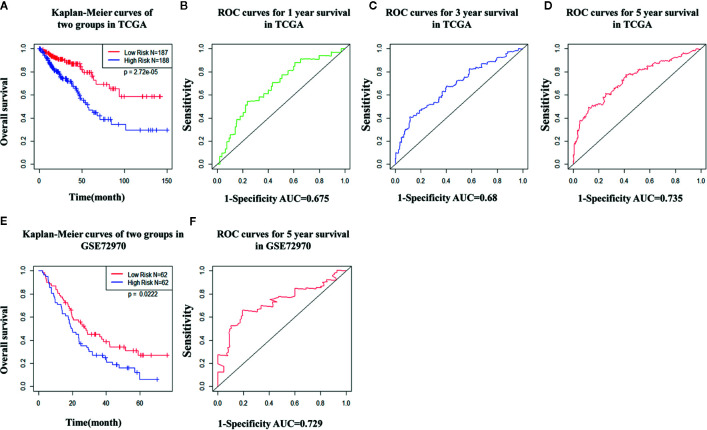
Figure 7.
The distribution of time-dependent receiver operating characteristic (ROC) curves and Kaplan-Meier survival based on the integrated classifier in The Cancer Genome Atlas (TCGA) and gene set enrichment. (A) Kapan-Meier curve of the TCGA cohort. (B–D) ROC curves for 1-year, 3-year, and 5-year survival in the TCGA cohort. (E) Kapan-Meier curve of the gene set enrichment cohort. (F) ROC curve for 5-year survival in the gene set enrichment cohort. ROC, receiver operator characteristic; AUC, the area under the curve.

