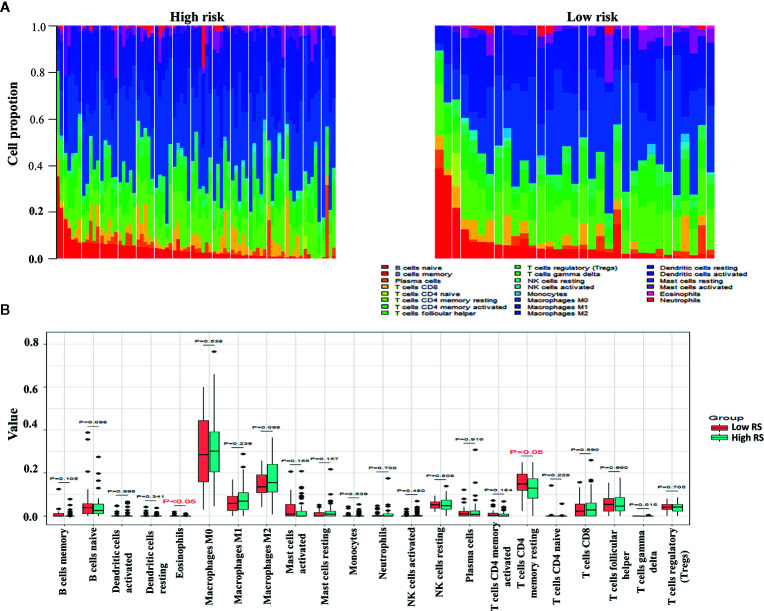
Figure 9.
Differences between leukocyte subsets in the high-risk group and the low-risk group in The Cancer Genome Atlas (TCGA) cohort. (A) Mean proportions of 22 immune cells in the TCGA cohort. (B) Differential immune cell type expression was observed between the high-risk group and the low-risk group in the TCGA cohort.

