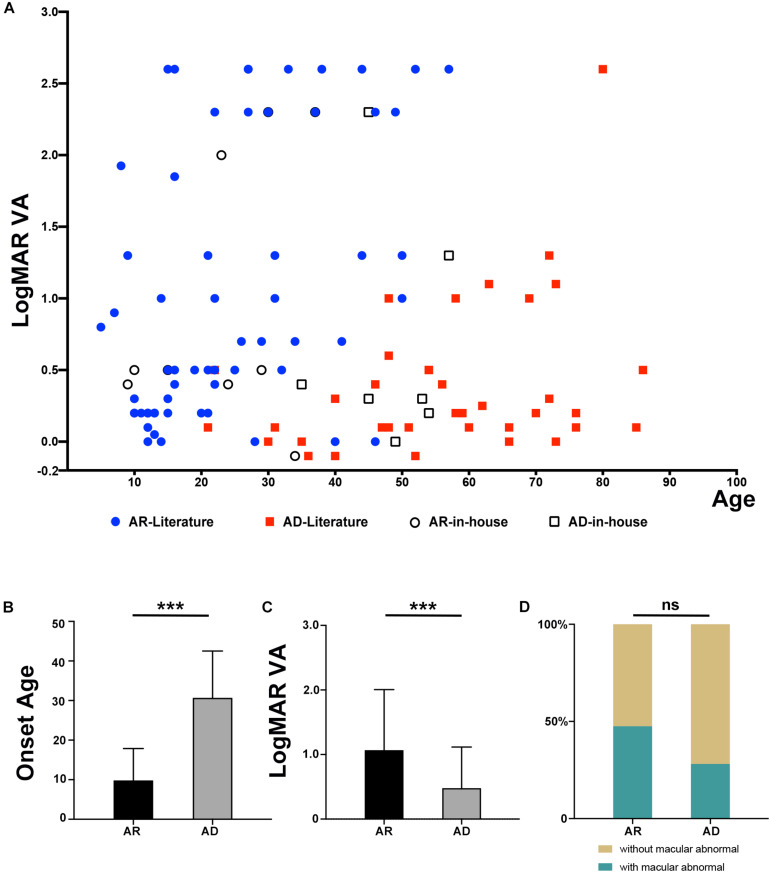
FIGURE 3.
Comparison of phenotypes in patients with an inheritance pattern for arRP and adRP. (A) Scatter plots of the LogMAR visual acuity of patients with AR and AD inheritance from our in-house data and the previously published literature. (B) Comparison of the onset ages of patients with AR and AD inheritance from our in-house data and the previously published literature. ***P = 2.76*10–11. (C) Comparison of the LogMAR visual acuity of patients with AR and AD inheritance from our in-house data and the previously published literature. ***P = 1.75*10–4. (D) Comparison of the macular abnormalities, including macular degeneration or macular atrophy, of patients with AR and AD inheritance from our in-house data and the previously published literature. ns mean not significant (P = 0.061).

