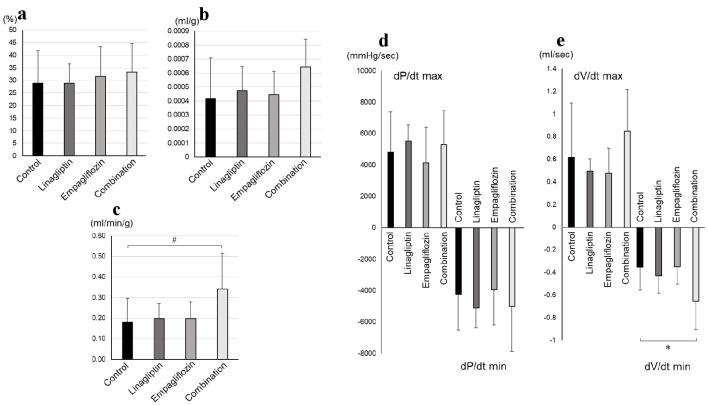
Figure 1.
Cardiac systolic parameters by Millar conductance catheter: (a) LV ejection fraction, (b) stroke volume, (c) cardiac index, (d) dP/dt, and (e) dV/dt were shown. LV: left ventricular; dP/dt max: the maximum peak time derivative of LV pressure; dP/dt min: the minimum peak time derivative of LV pressure; dV/dt max: LV volume at the peak LV filling rate; dV/dt min: LV volume at the peak LV ejection rate. The number of control, linagliptin, empagliflozin, and combination groups were 8, 7, 7, and 6, respectively. *P < 0.05; #P < 0.10 by one-way analysis of variance with post-hoc comparison using Dunnett’s test.

