
Fig. 5 |. Examples of ECG traces.
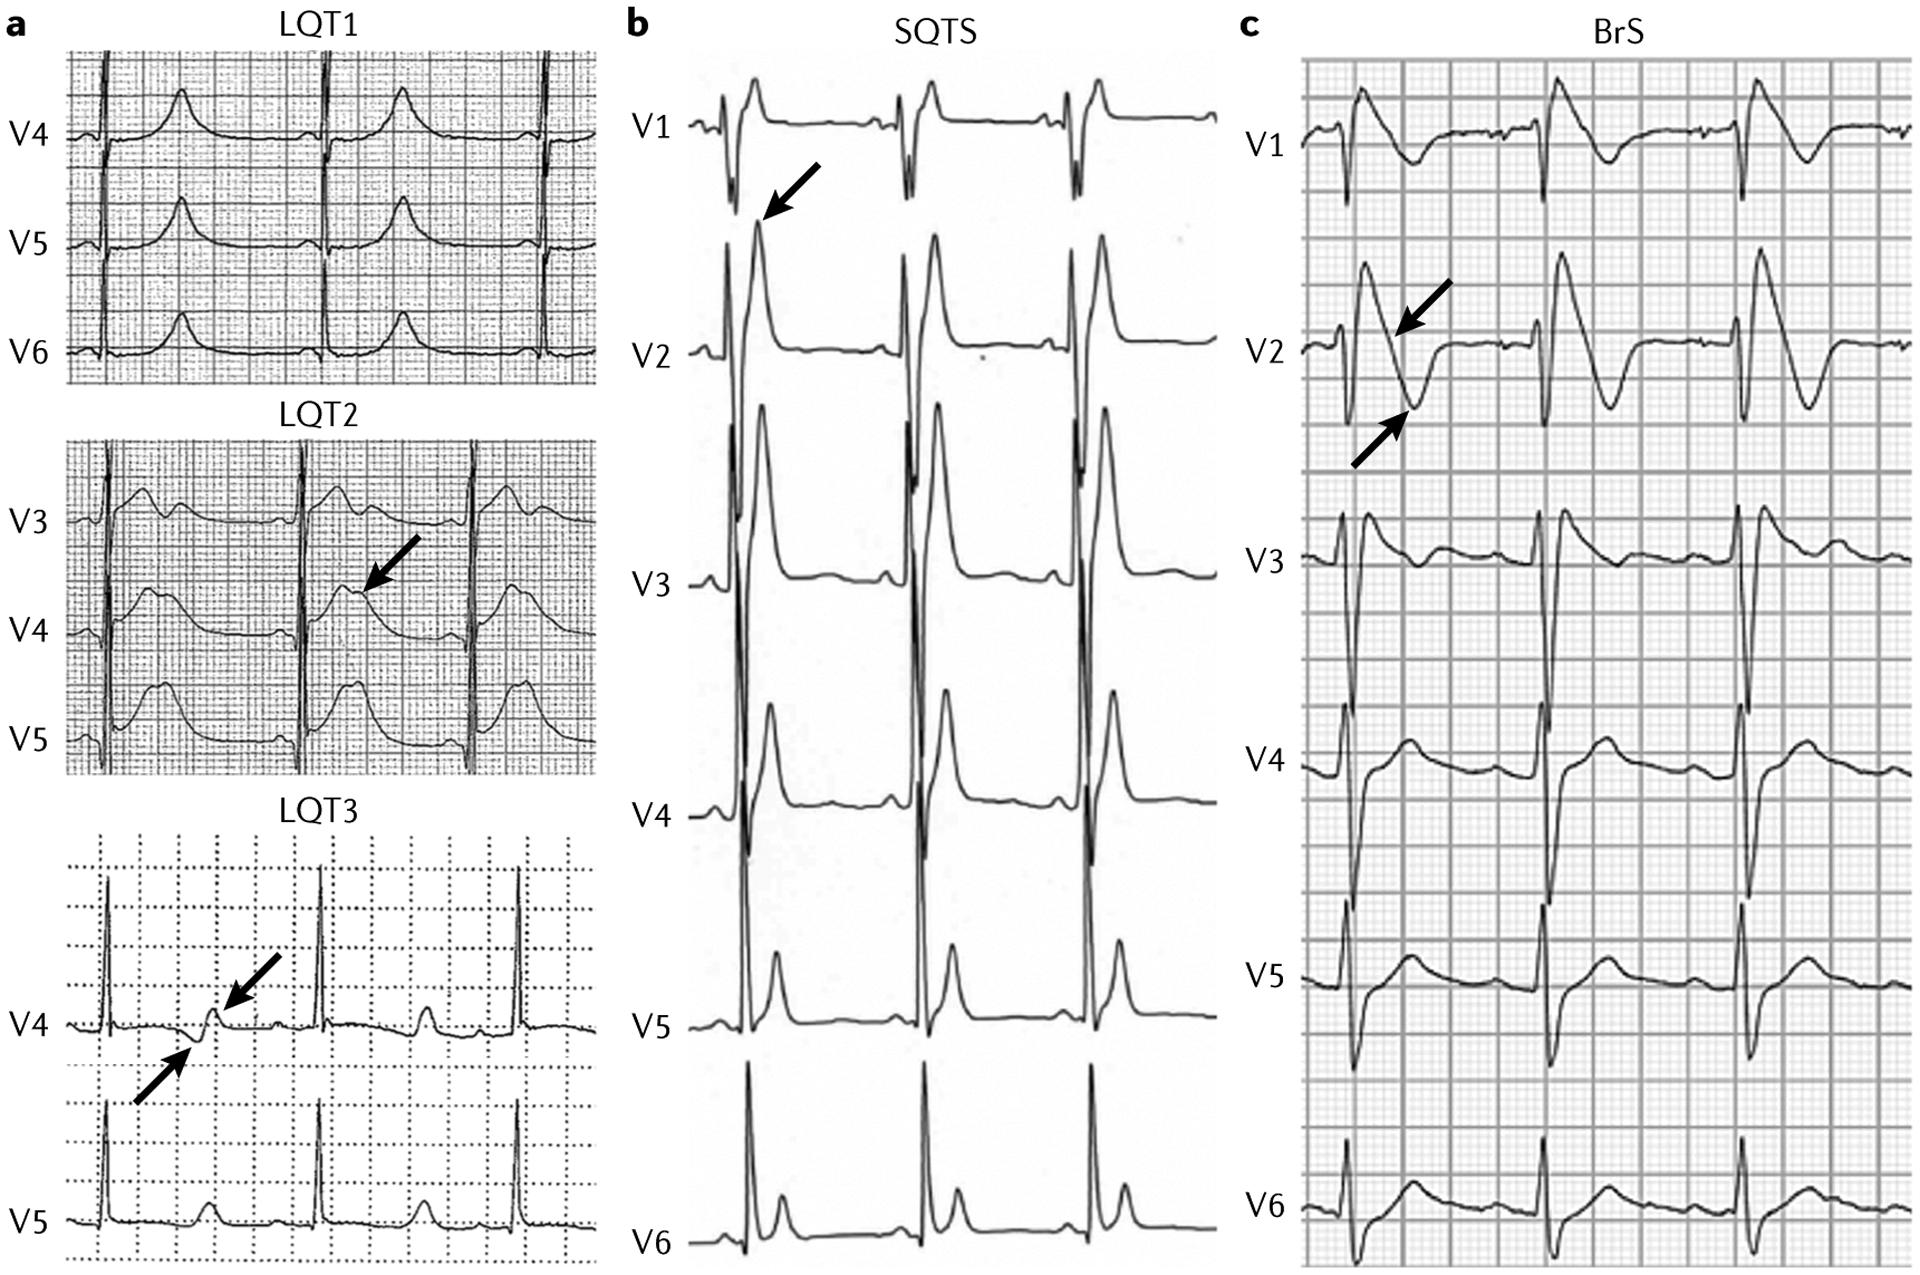
a | Example of electrocardiogram (ECG) traces of patients with long QT syndrome (LQTS). In LQTS type 1 (LQT1), the QT interval is extremely prolonged, with a tall peaked T wave. In LQT2, a very prolonged QT interval is present, with a clear and typical notch on the T wave (arrow). In LQT3, a very prolonged QT interval is followed by a late-onset diphasic (arrows) T wave. b | In a patient with short QT syndrome (SQTS), the QT interval is extremely short, with a tall peaked T wave (arrow). c | A patient with Brugada syndrome (BrS) has an ECG trace with a typical type 1 pattern. There is a coved-type ST segment (arrow) in the right precordial leads followed by a terminal negative T wave (arrow).