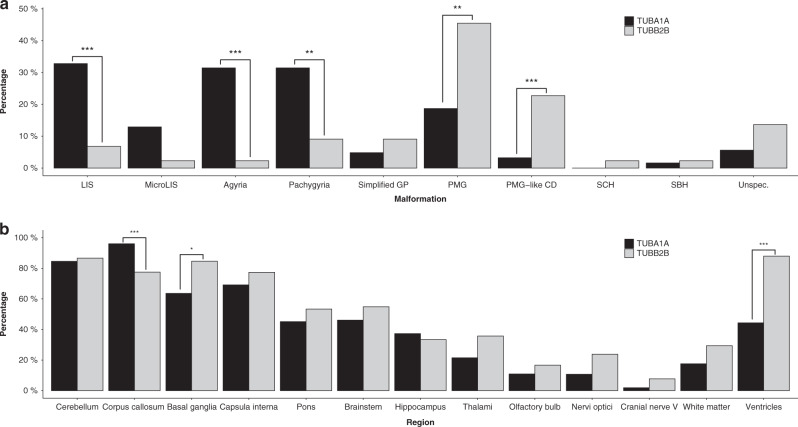
Fig. 3. Frequency of cortical (a) and extracortical findings (b) in the TUBA1A (black) and TUBB2B (gray) cohorts.
Statistically significant differences are marked with asterisks. LIS lissencephaly, MicroLIS microlissencephaly, PMG polymicrogyria, PMG-like CD polymicrogyria-like cortical dysplasia, SBH subcortical band heterotopia, SCH schizencephaly, Simplifed GP simplified gyral pattern, Unspec. unspecified. Level of significance: * ≤ 0.05, ** ≤ 0.01, *** ≤ 0.001.

