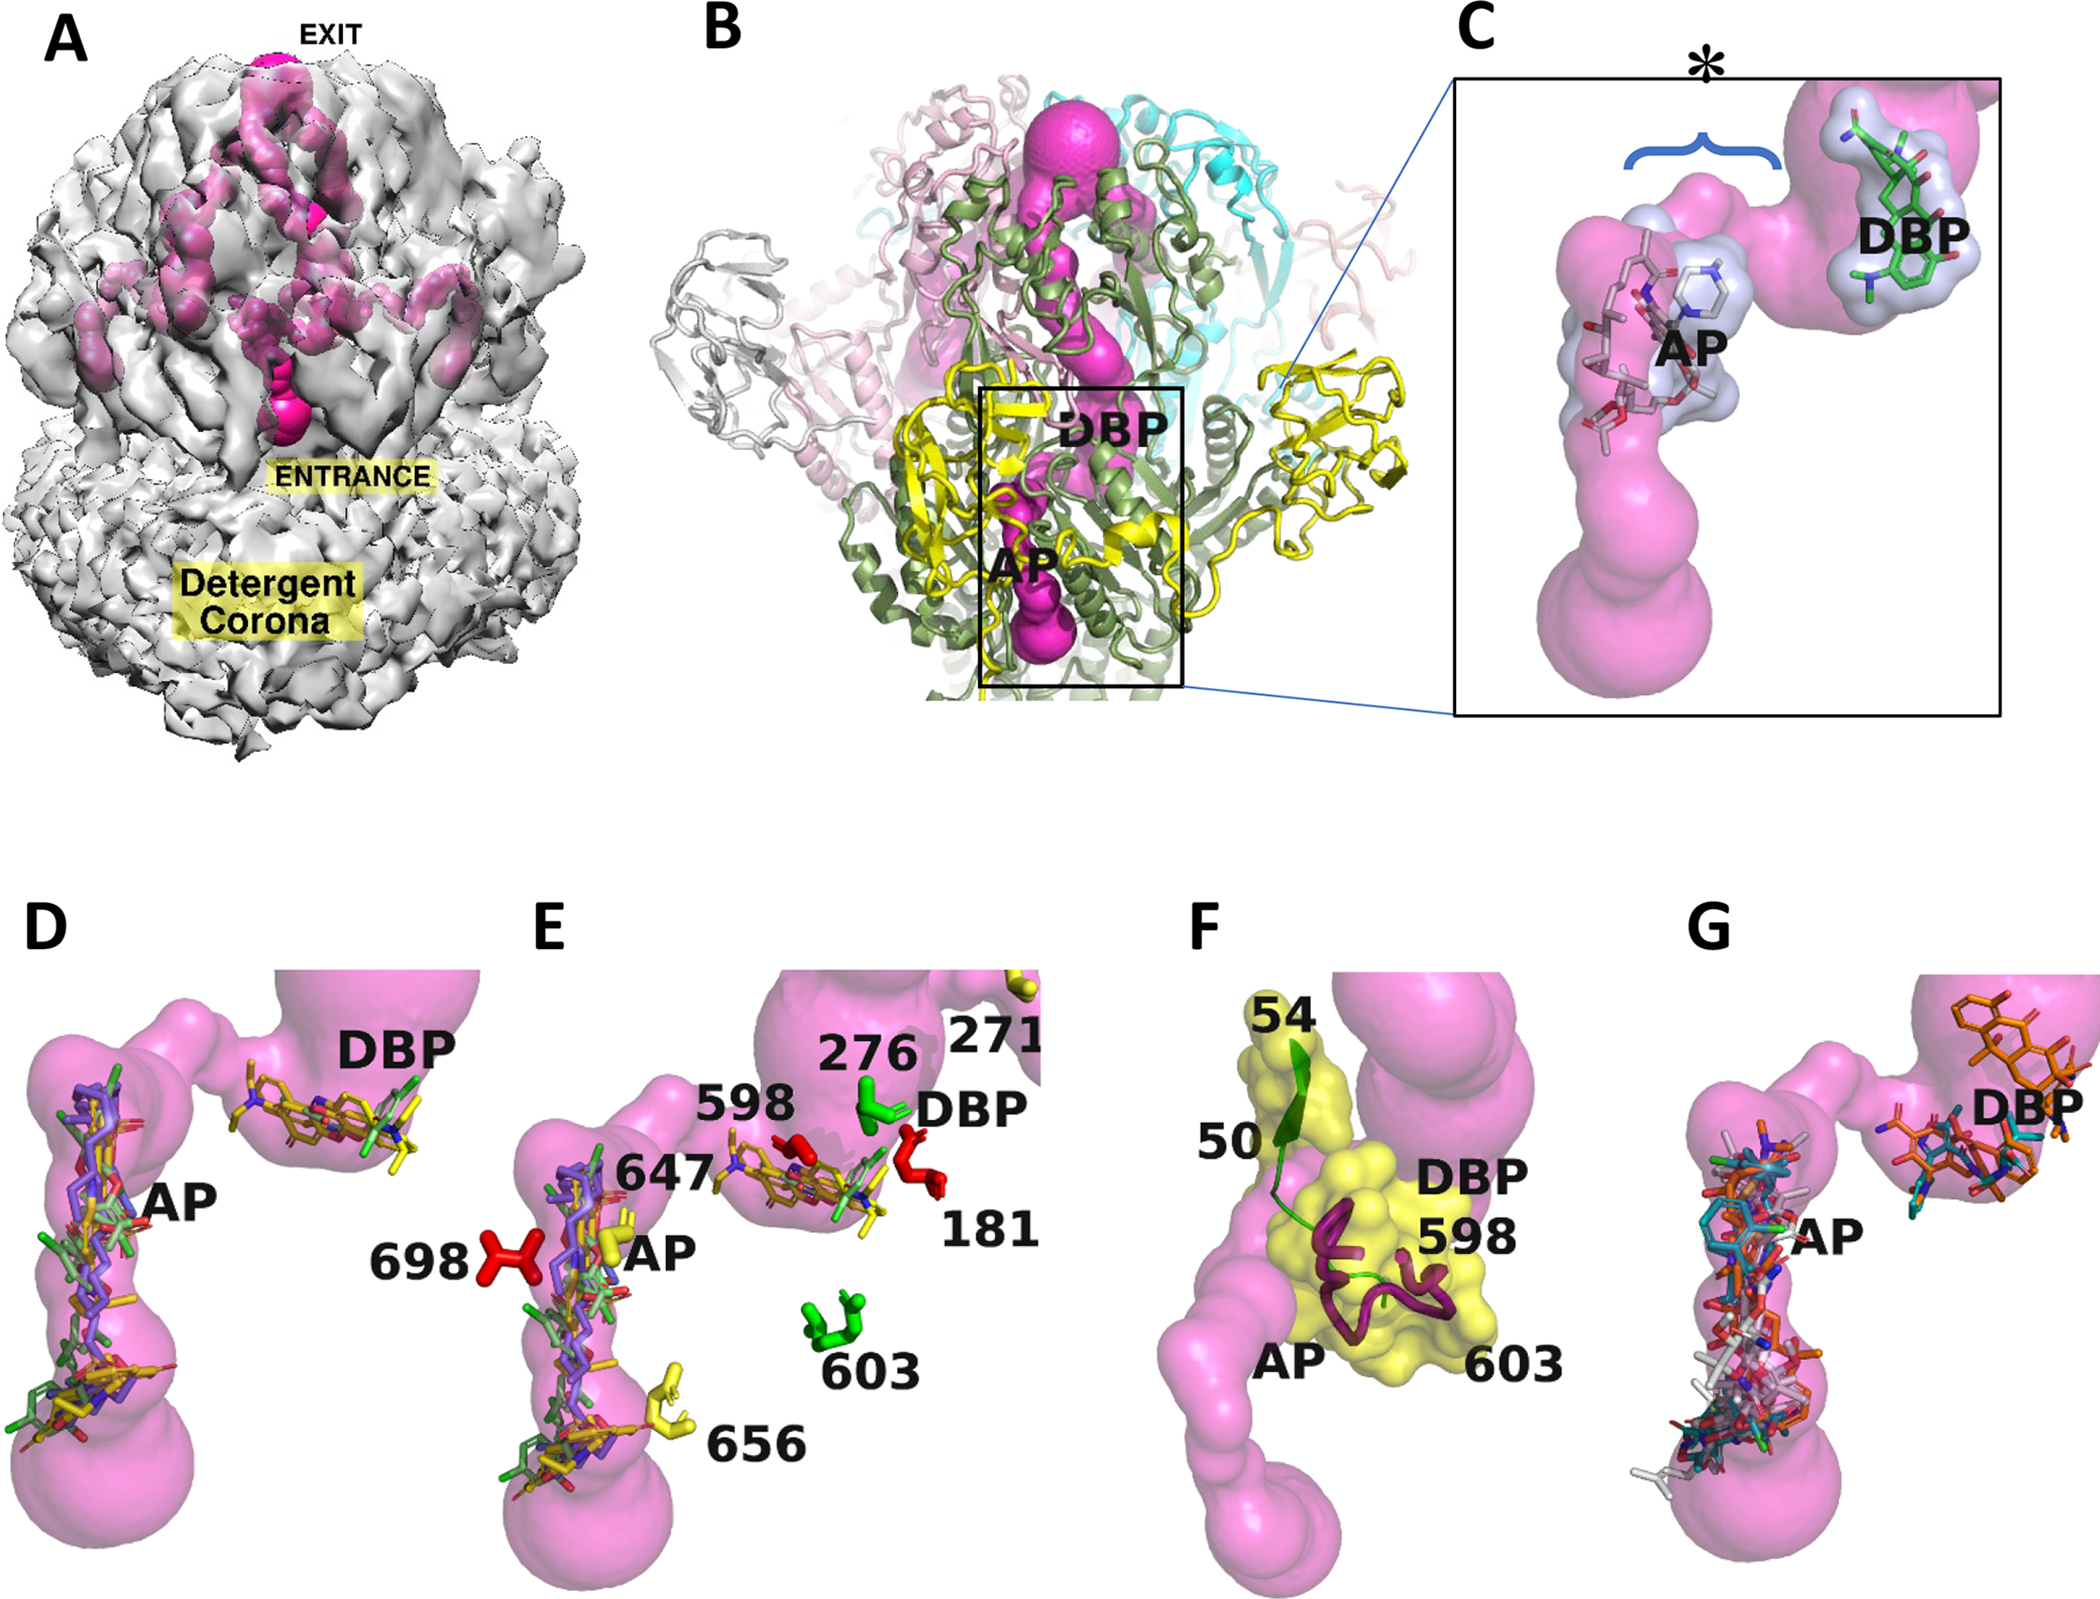
Fig. 5. Intramolecular ligand-accessible channels in the TriABC trimer.

Trimeric tunnel network is depicted as solid surfaces colored (hot pink), using the structure of a TriABC protomer.
A. The tunnel network is shown embedded in the C3 cryoEM density (2σ), and has an overall length of approximately 190 Å in each TriC subunit. The entrance to the tunnel is shown labelled for the TriC subunit facing the viewer and commences at the interface of TriC with the outer leaflet of the inner membrane with egress at the funnel like exit formed by the docking domains of the TriC protomers. The complete tunnel network of TriABC including that in the adjacent subunits is shown by making the C3 cryo-EM density semi-transparent.
B. Superposition of AcrB (Nakashima et al, 2011) onto the TriC protomer positions in TriC the AcrB ligand binding sites referred to as the proximal access pocket (AP) and distal binding pocket (DBP). The tunnel narrows to 2.2Å diameter in the region between the AP and DBP sites.
C. Close-up of rifampicin (grey) and minocycline (green) bound in AcrB (Nakashima et al, 2011) at the AP and DBP loci, respectively, and shown as stick representations surrounded by transparent van der Waals surfaces, positioned at the putative homologous binding loci in TriC, and coincide with the tunnel network. The labels AP and DBP were placed the center of mass of the respective antibiotic. The bottleneck region is identified by an * and its extent by a brace.
D. Docking calculations using BSP-SLIM (Lee and Zhang, 2012) showing the 5 highest scoring poses for each substrate: SDS, triclosan, and Nile Red, as stick representations in a TriABC protomer, their respective carbon atoms are colored slate, green, and yellow.
E. Close-up of the region between AP and DBP (labels slightly displaced for clarity) showing the position of the mutated residues that are listed in Fig. 5. Coloured in red are the residues that upon mutation severely modified extrusion activity, in green partially impacted activity, while the residues whose mutation did not impact extrusion activity are coloured in yellow.
F. Tunnel closeup showing secondary structure and associated van der Waals surfaces adjacent to the tunnel bottleneck (2.2Å) between the AP and DBP sites. The bottleneck is bounded by β strand (50–54) on one side and the gating loop (598–614) on the other side, Cα traces are shown in green and red respectively. Position of mutated residues are labelled in the gating loop.
G. Docking calculations using BSP-SLIM showing the 5 highest scoring poses for antibiotics tetracycline, cloxacillin, and novobiocin, that are not extruded by TriABC, as stick representations. Their respective carbon atoms are colored brown, green, and white.
