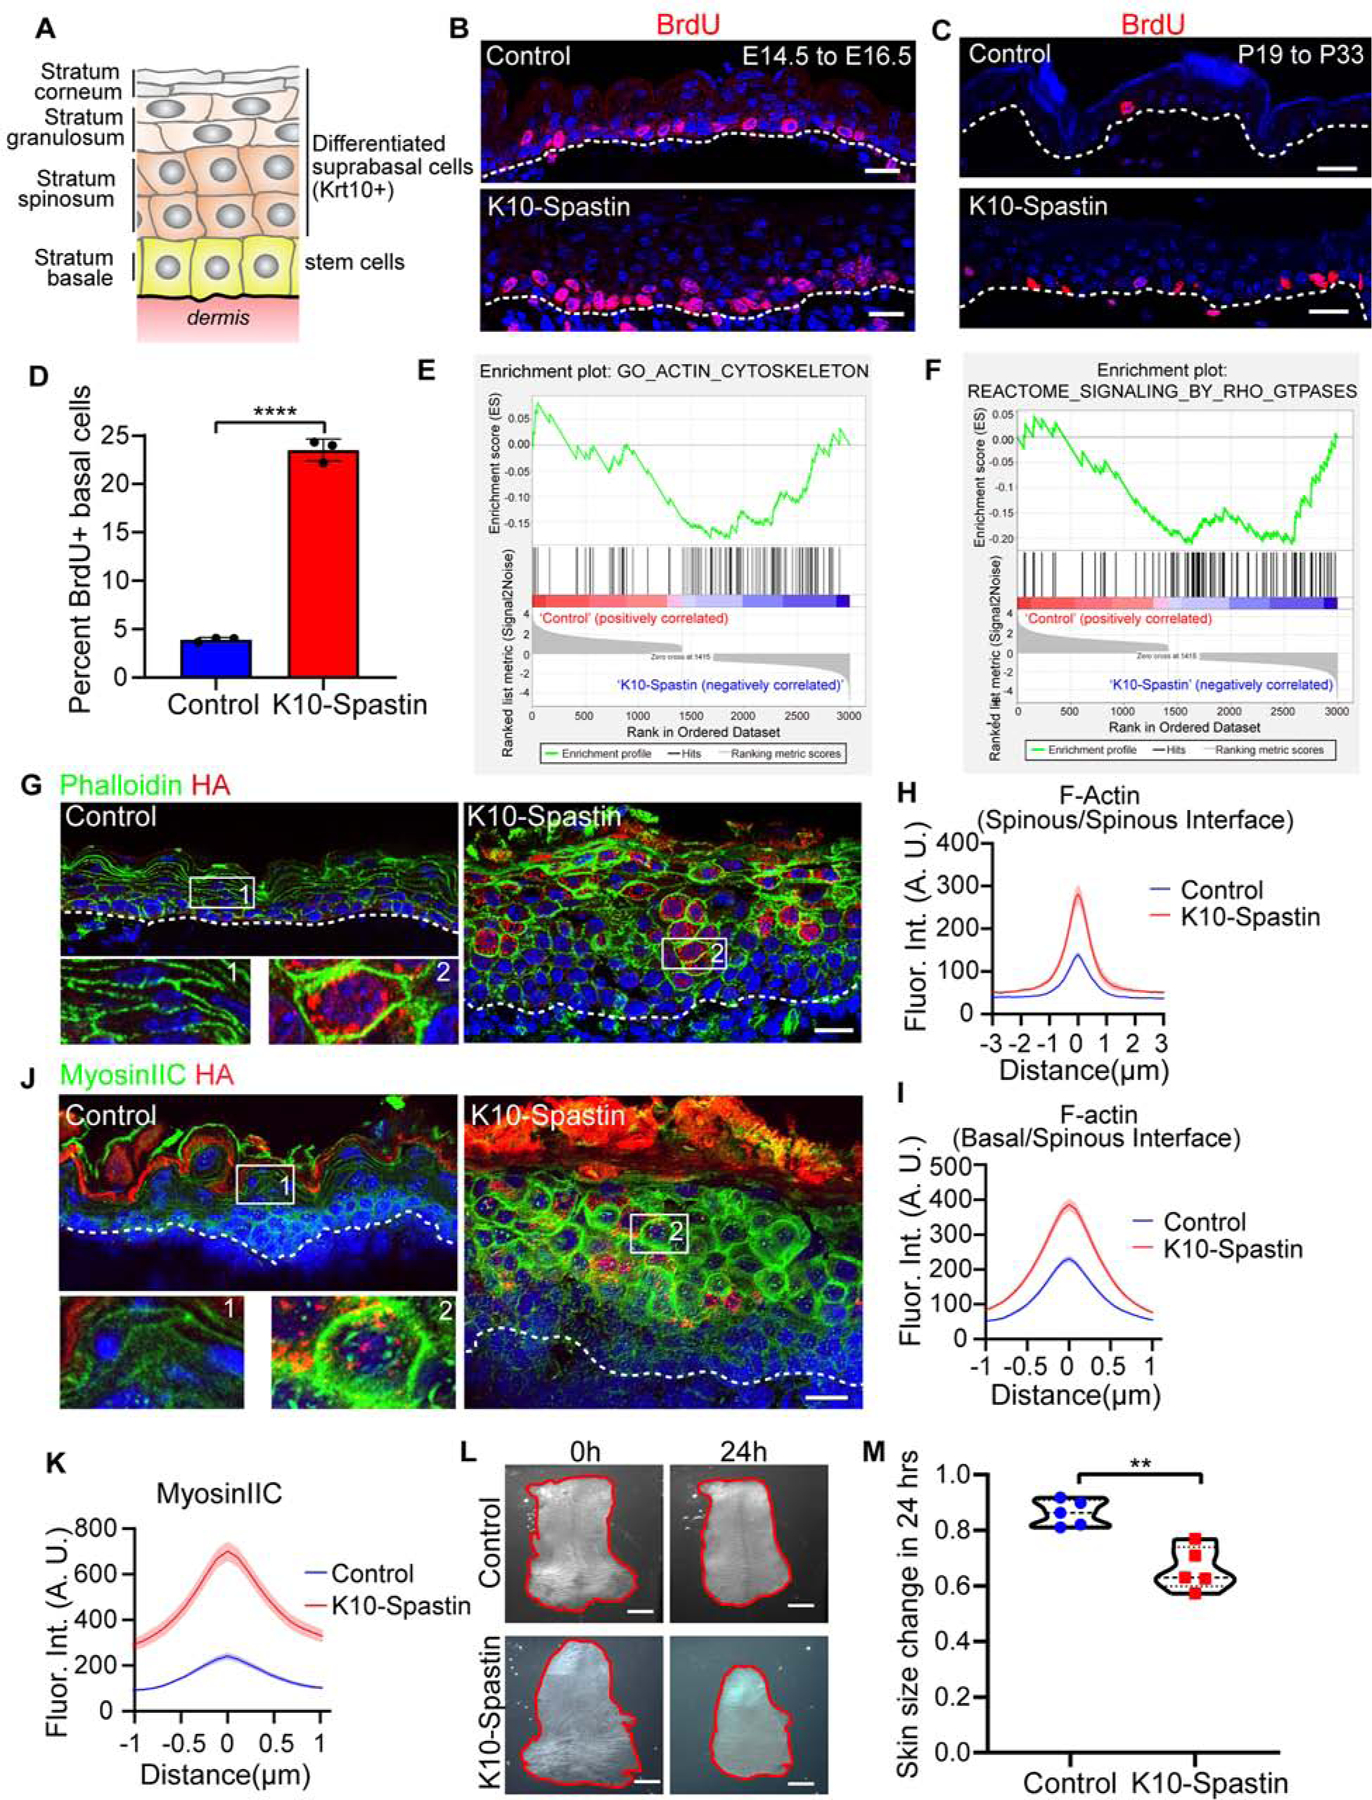
Figure 1. Microtubule disruption increases cortical actomyosin.

(A) Schematic of the stratified epidermis with basal stem cells and their progeny-Krt10+ differentiated suprabasal cells.
(B and C) BrdU (red) immunofluorescence staining in control and K10-Spastin epidermis at E16.5 (B), and in adult (C). Embryos/mice were exposed to doxycycline from E14.5–16.5 for (B) and from P19–33 for (C). Scale bars, 20 μm.
(D) Percentage of BrdU+ basal cells in treated adult backskin epidermis. Data is mean ± SD, n=3 mice for control (36 fields) and K10-Spastin (38 fields), p-value<0.0001, two-tailed unpaired t-test.
(E and F) Gene Set Enrichment Analysis (GSEA) of RNA-Seq data for control and K10-Spastin, revealing an actin cytoskeleton gene signature (E) and Rho-GTPase reactome signaling related genes (F) enriched in K10-Spastin. Normalized enrichment score (NES): −1.42, FDR: 0.016, p-value: 0.003 for (E); and NES: −1.56, FDR: 0.0125, p-value: 0.003 for (F).
(G) Immunofluorescence staining of F-actin labeled by phalloidin (green) and HA-Spastin (red) in the epidermis at E16.5. Embryos were exposed to doxycycline from E14.5. Scale bar, 20 μm.
(H) Quantification of F-actin fluorescence intensity at spinous cell-spinous cell boundaries in control and K10-Spastin. Data is mean ± SEM, n=38 cells for control and n=39 cells for K10-Spastin from 3 embryos, p-value <0.0001, two-tailed unpaired t-test.
(I) Quantification of interface F-actin intensity between spinous and basal cells. In the K10-Spastin epidermis, only the interface F-actin between HA+ spinous and basal cells was measured. Data is mean ± SEM, n=61 cells for control and n=86 cells for K10-Spastin from 3 embryos, p-value <0.0001, two-tailed unpaired t-test.
(J) Immunofluorescence staining of cortical MyosinIIC (green) and Spastin-HA (red) at E16.5, doxycycline was added at E14.5. Scale bar, 20 μm.
(K) Quantification of MyosinIIC fluorescence intensity at cell-cell boundaries of suprabasal cells. Data is mean ± SEM, n=40 cells for control and n=50 cells for K10-Spastin from 3 embryos, p-value <0.0001, two-tailed unpaired t-test.
(L) Skin explants of control and K10-Spastin at the beginning (E15.5) and 24 hours later (sustained with 2 μg/ml doxycycline). Scale bars, 1mm.
(M) Changes of skin explant area over 24 hours. Shown are violin plots with each measurement being the skin from a distinct embryo, n=5 embryos for control and K10-Spastin from 3 litters were measured, p-value<0.01, two-tailed unpaired t-test.
