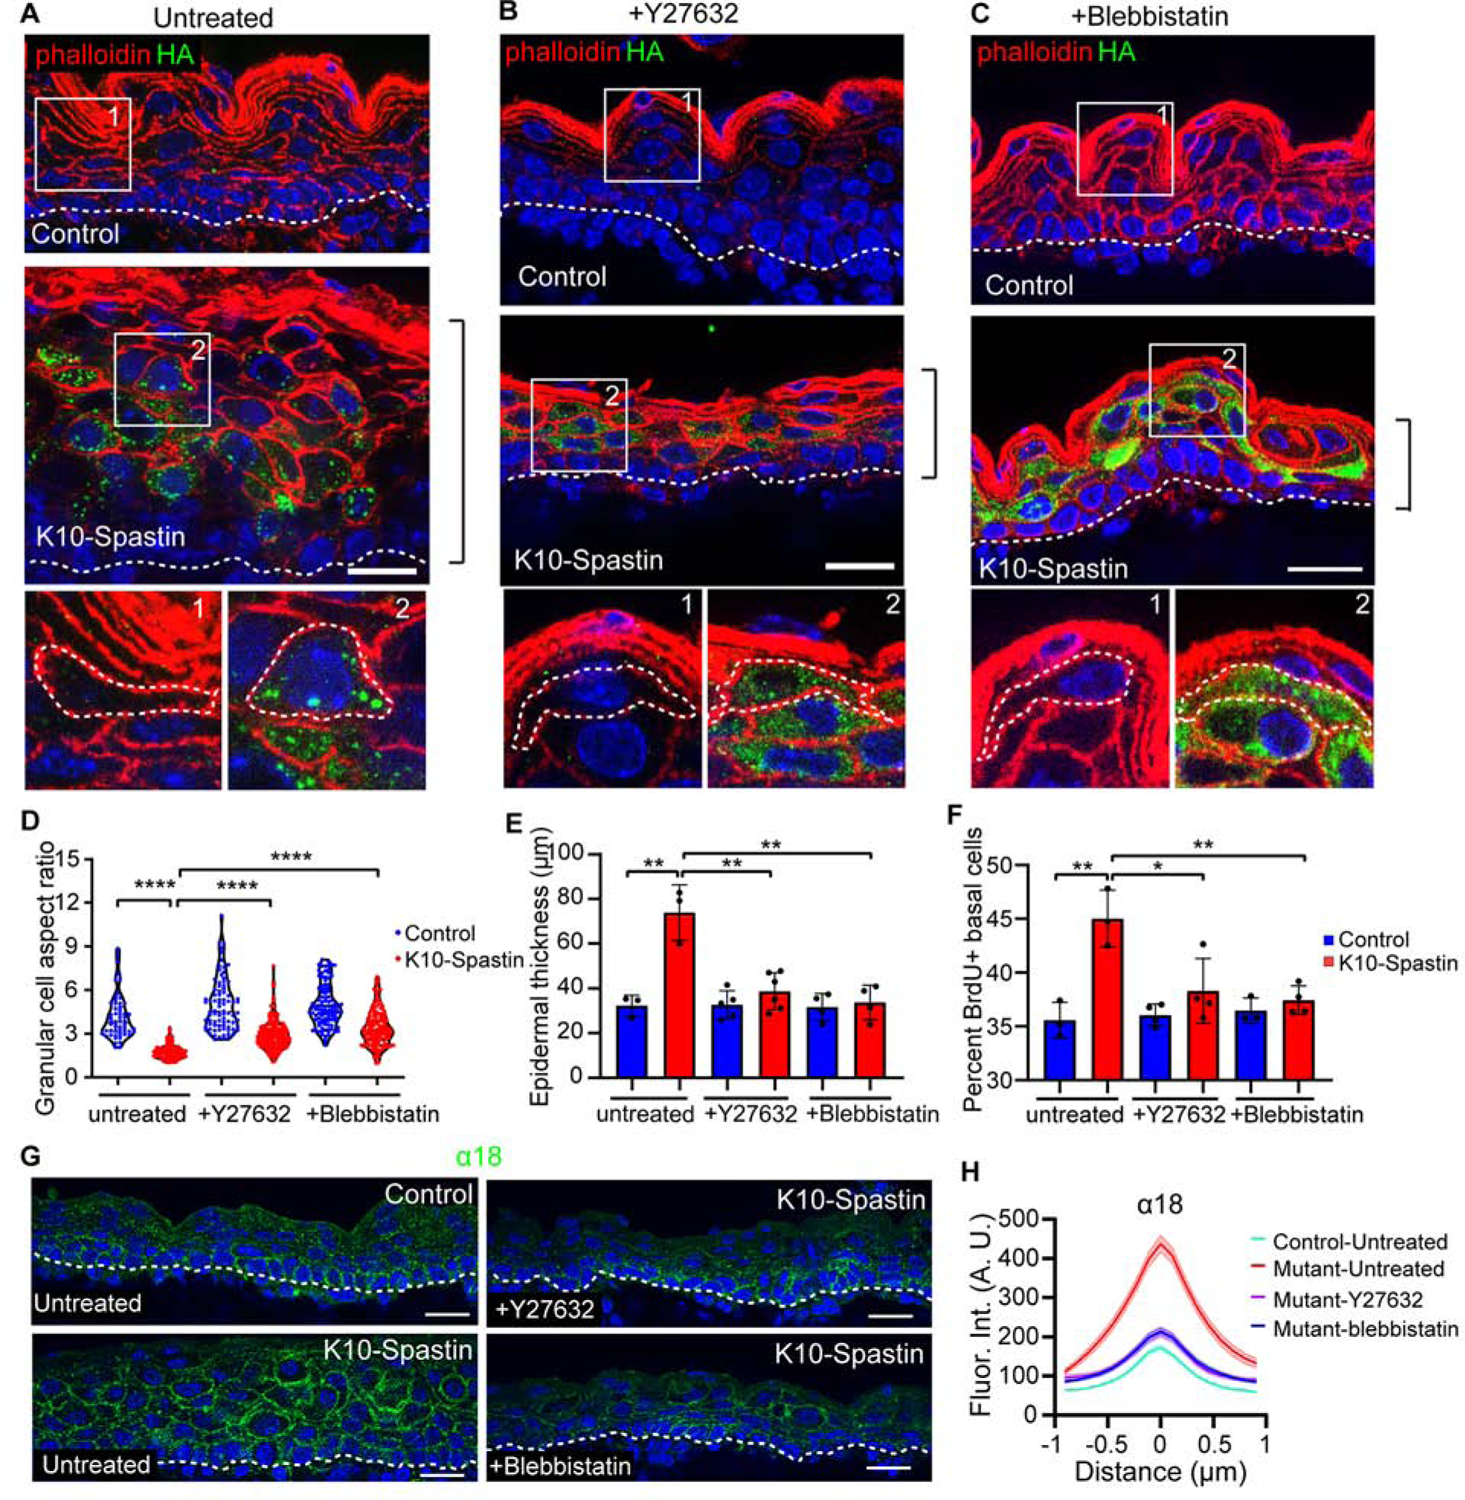
Figure 3. Decreasing contractility rescues skin thickness, cell shape and basal cell hyperproliferation caused by microtubule disruption in suprabasal cells.

(A-C) Immunofluorescence staining of Spastin-HA (green) and F-actin (red) in untreated (A), Y27632 (B), and blebbistatin (C) injected control and K10-Spastin epidermis, respectively. Scale bars, 20 μm.
(D) Quantification of granular cell aspect ratio in untreated, Y27632, and blebbistatin treated control and K10-Spastin epidermis. Each point represents a single cell. For the untreated condition, n=58 cells for control and n=102 cells for K10-Spatin from 3 embryos. For Y27632, n=83 cells for control and n=171 cells for K10-Spastin from 4 embryos. For blebbistatin, n=105 cells for control and n=146 cells for K10-Spastin from 4 embryos. p-value<0.0001, two-tailed unpaired t-test.
(E) Quantification of skin thickness in untreated, Y27632, and blebbistatin treated control and K10-Spastin epidermis. Data is mean ± SD. For untreated condition, n=3 embryos for control (89 regions) and K10-Spastin (102 regions) from 2 untreated litters were measured. For Y27632, n=5 embryos for control (182 regions) and n=6 embryos for K10-Spastin (255 regions) from 3 injected litters were measured. For blebbistatin, n=4 embryos for control (133 regions) and K10-Spastin (214 regions) from 3 injected litters were measured. p-value<0.01, two-tailed unpaired t-test.
(F) Percentage of BrdU+ basal cells in untreated, Y27632, and Blebbistatin treated control and K10-Spastin epidermis. Data is mean ± SD. For untreated, n=3 embryos for control (31 fields) and K10-Spastin (40 fields). For Y27632, n=4 embryos for control (32 fields) and K10-Spastin (38 fields). For blebbistatin, n=3 embryos for control (31 fields) and n=4 embryos for K10-Spastin (47 fields). For the analysis: control to K10-Spastin untreated group: p-value<0.01; K10-Spastin untreated to Y27632 treated group: p-value=0.0279; K10-Spastin untreated to blebbistatin treated group: p-value<0.01; all are two-tailed unpaired t-test.
(G) Staining of α−18 in untreated control, untreated and drug treated K10-Spastin epidermis at E16.5. Scale bars, 20 μm.
(H) Measurement of cortical α−18 in untreated control, untreated and drug treated K10-Spastin epidermis. Data is mean ± SEM, n=36 cells for untreated control, n=44 cells for untreated K10-Spatin, n=42 cells for Y-27632 treated K10-Spastin, and n=45 cells for blebbistatin treated K10-Spastin, 3 embryos for all conditions were measured. For untreated to Y-27632 or blebbistatin K10-Spastin, and untreated K10-Spastin to control, p-value<0.0001, two-tailed unpaired t-test.
