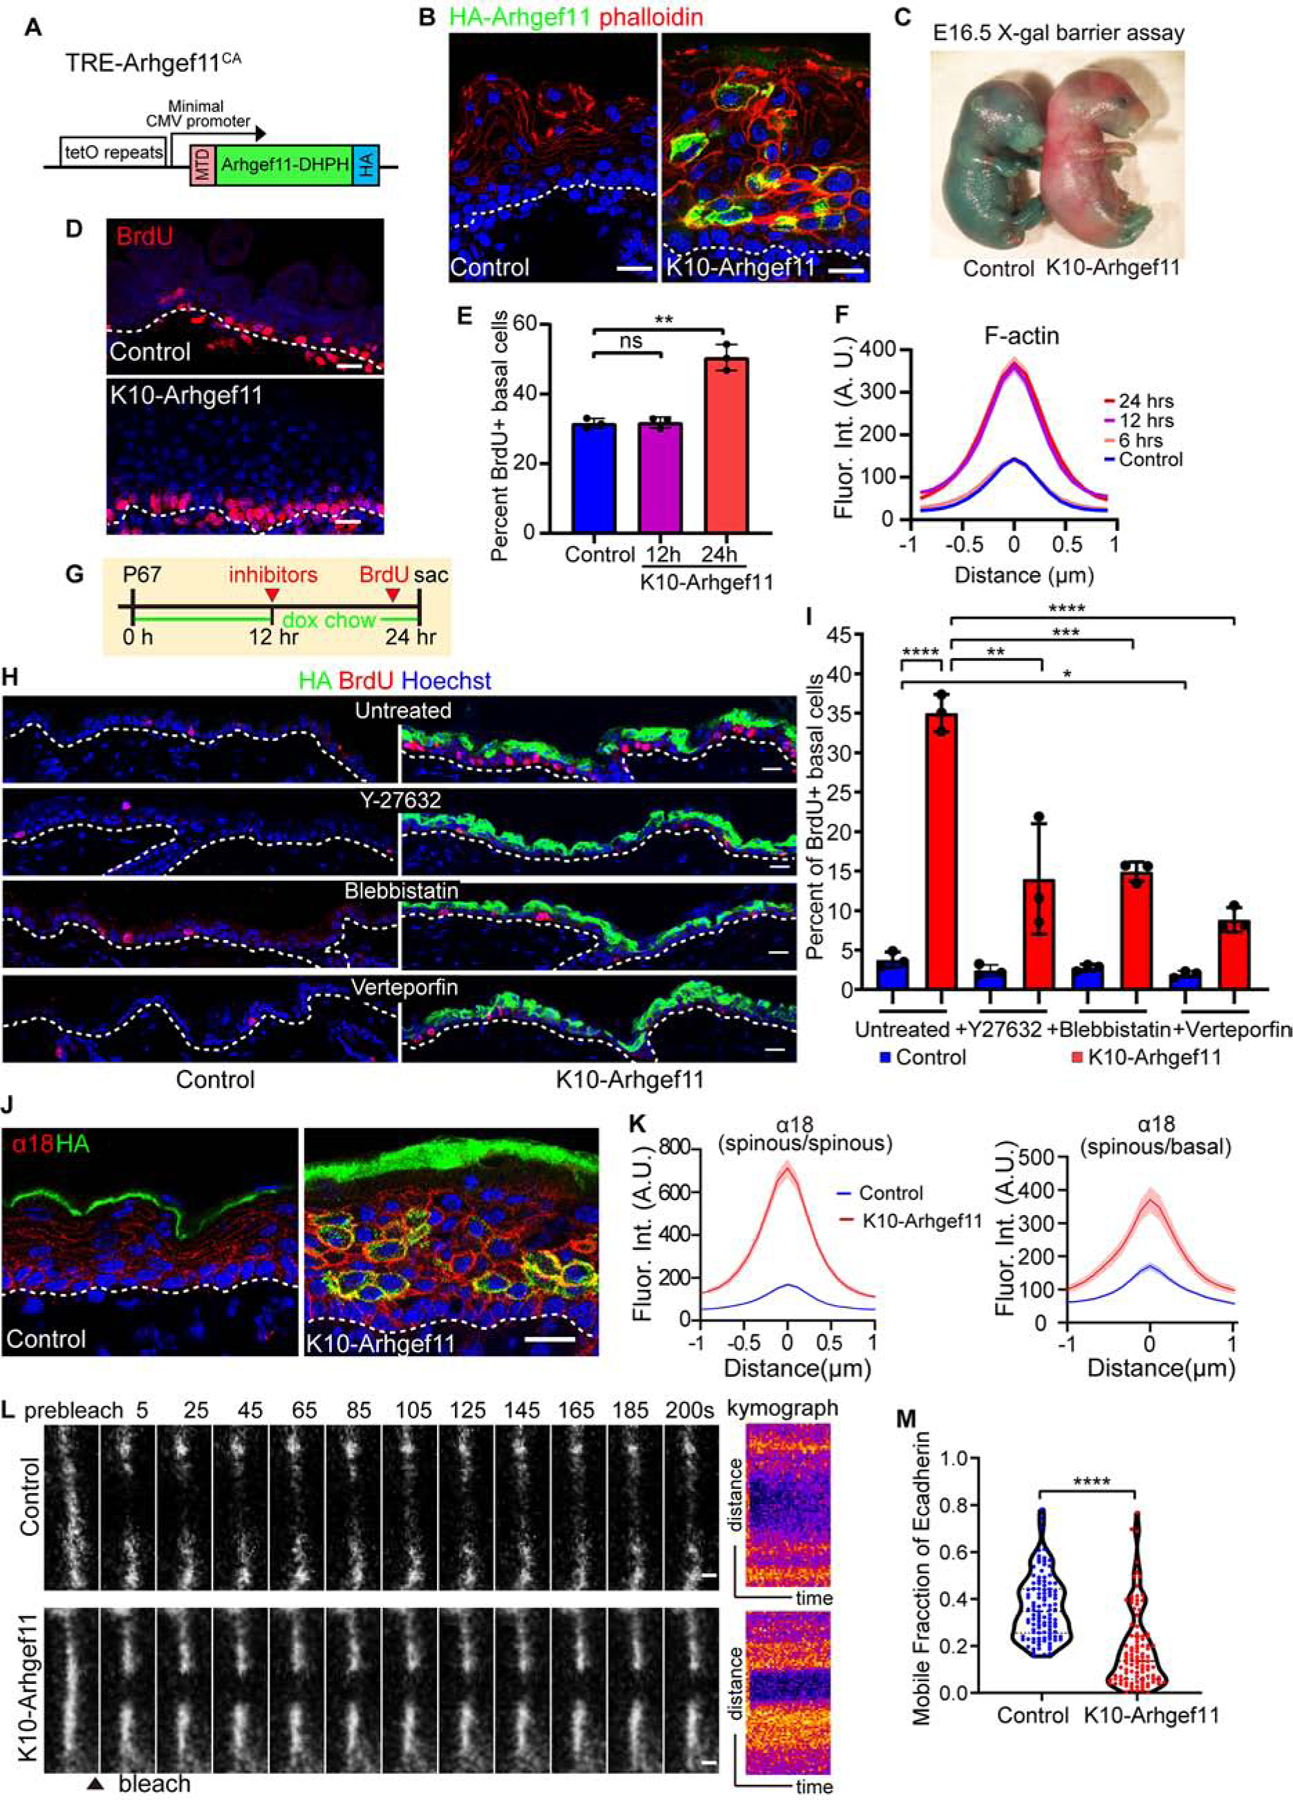
Figure 4. RHO-GEF induced contractility stabilizes adherens junction and induces stem cell proliferation.

(A) Diagram of the TRE-Arhgef11CA transgene. Arhgef11-DHPH was tagged with a membrane targeting domain (MTD) at the N-terminus and an HA tag at the C-terminus.
(B) Co-staining of F-actin (phalloidin, red) and Arhgef11-HA (green) in the epidermis of control and K10-Arhgef11 at E17.5, doxycycline since E13.5. Scale bars, 20 μm.
(C) Skin X-gal barrier assay of E16.5 control and K10-Arhgef11 embryos. Absence of dye indicates an effective outside-in barrier.
(D) BrdU staining in control and K10-Arhgef11 epidermis at E17.5, doxycycline-treated from E13.5. Scale bar, 20 μm.
(E) Percentage of BrdU+ basal cells in control and K10-Arhgef11 E16.5 embryos, 12 and 24 hrs after doxycycline administration. Data is mean ± SD, n=3 embryos for control (16 fields) and K10-Arghef11 – 12 hrs (14 fields) and 24 hrs (17 fields) of K10-Arhgef11. For control to 12 hrs, p-value=0.8488, for control to 24 hrs, p-value<0.01, two-tailed unpaired t-test.
(F) Fluorescence intensity of cortical F-actin in control and K10-Arghef11 E16.5 embryos, 6, 12 and 24 hrs after doxycycline administration. Data is mean ± SEM, n=35 cells for control (3 embryos); n=37 cells for 6 hrs (2 embryos), n=42 cells for 12 hrs (3 embryos), and n=35 cells for 24 hrs (3 embryos) of K10-Arhgef11. For 6 hrs to control, p-value=0.876; 12 hrs to control, p-value<0.0001; for 12 hrs to 24 hrs, p-value=0.719, two-tailed unpaired t-test.
(G) Diagram depicting the drug injection time in K10-Arhgef11. Mice at P67 were fed with doxycycline chow, injected with inhibitors after 12 hours on doxycycline, and injected with BrdU 1 hour before sacrifice at 24 hr.
(H) Immunofluorescence staining of BrdU in untreated, Y27632, blebbistatin and verteporfin treated control (left) and K10-Arhgef11 (right) adult epidermis. Scale bars, 20 μm.
(I) Percentage of BrdU+ basal cells in untreated, Y27632, blebbistatin and verteporfin treated control and K10-Arhgef11 adult epidermis. Data is mean ± SD, n=3 mice for all groups, for untreated control (30 fields) and K10-Arhgef11 (33 fields), for Y-27632 treated control (22 fields) and K10-Arhgef11 (38 fields), for blebbistatin treated control (32 fields) and K10-Arhgef11 (35 fields), and for verteporfin treated control (31 fields) and K10-Arhgef11 (36 fields) were measured. For the analysis: untreated control to K10-Arhgef11, p-value<0.0001; untreated to Y-27632 treated control, p=0.1336; untreated to blebbistatin treated control, p=0.1991; untreated to verteporfin treated control, p<0.05; untreated to Y-27632 treated K10-Arhgef11, p<0.01; untreated to blebbistatin treated K10-Arhgef11, p<0.001; untreated to verteporfin treated K10-Arhgef11, p<0.0001; all are two-tailed unpaired t-test.
(J) Co-staining of α−18 (red) and Arhgef11-HA (green) in control and K10-Arhgef11 epidermis at E17.5. Scale bar, 20 μm.
(K) Left: Quantification of cortical α−18 fluorescence intensity in control and K10-Arhgef11spinous cells. Data is mean ± SEM, n=35 cells for control and n=51 cells for K10-Arhgef11 from 3 embryos, p-value <0.0001, two-tailed unpaired t-test. Right: Quantification of α−18 intensity at the interface between basal and spinous cells. In K10-Arhgef11, only α−18 at the interface between HA+ spinous and basal cells was measured. Data is mean ± SEM, n=26 cells for control and n=23 cells for K10-Arhgef11 from 3 embryos, p-value <0.0001, two-tailed unpaired t-test.
(L) Time-lapse series of E-cadherin-CFP FRAP in suprabasal cells in control and K10-Arhgef11epidermis at E15.5. Kymograph of E-cadherin-CFP over 200 seconds is shown on the right. Scale bars, 1 μm.
(M) Quantification of E-cadherin-CFP recovery rate in 200 seconds after photobleaching in suprabasal cells. Note that the dataset displayed for the control here is the same as in Figure 2H. For control, n=107 regions from 6 embryos, for K10-Arhgef11, n= 102 regions from 3 embryos, p-value<0.0001, two-tailed unpaired t-test.
