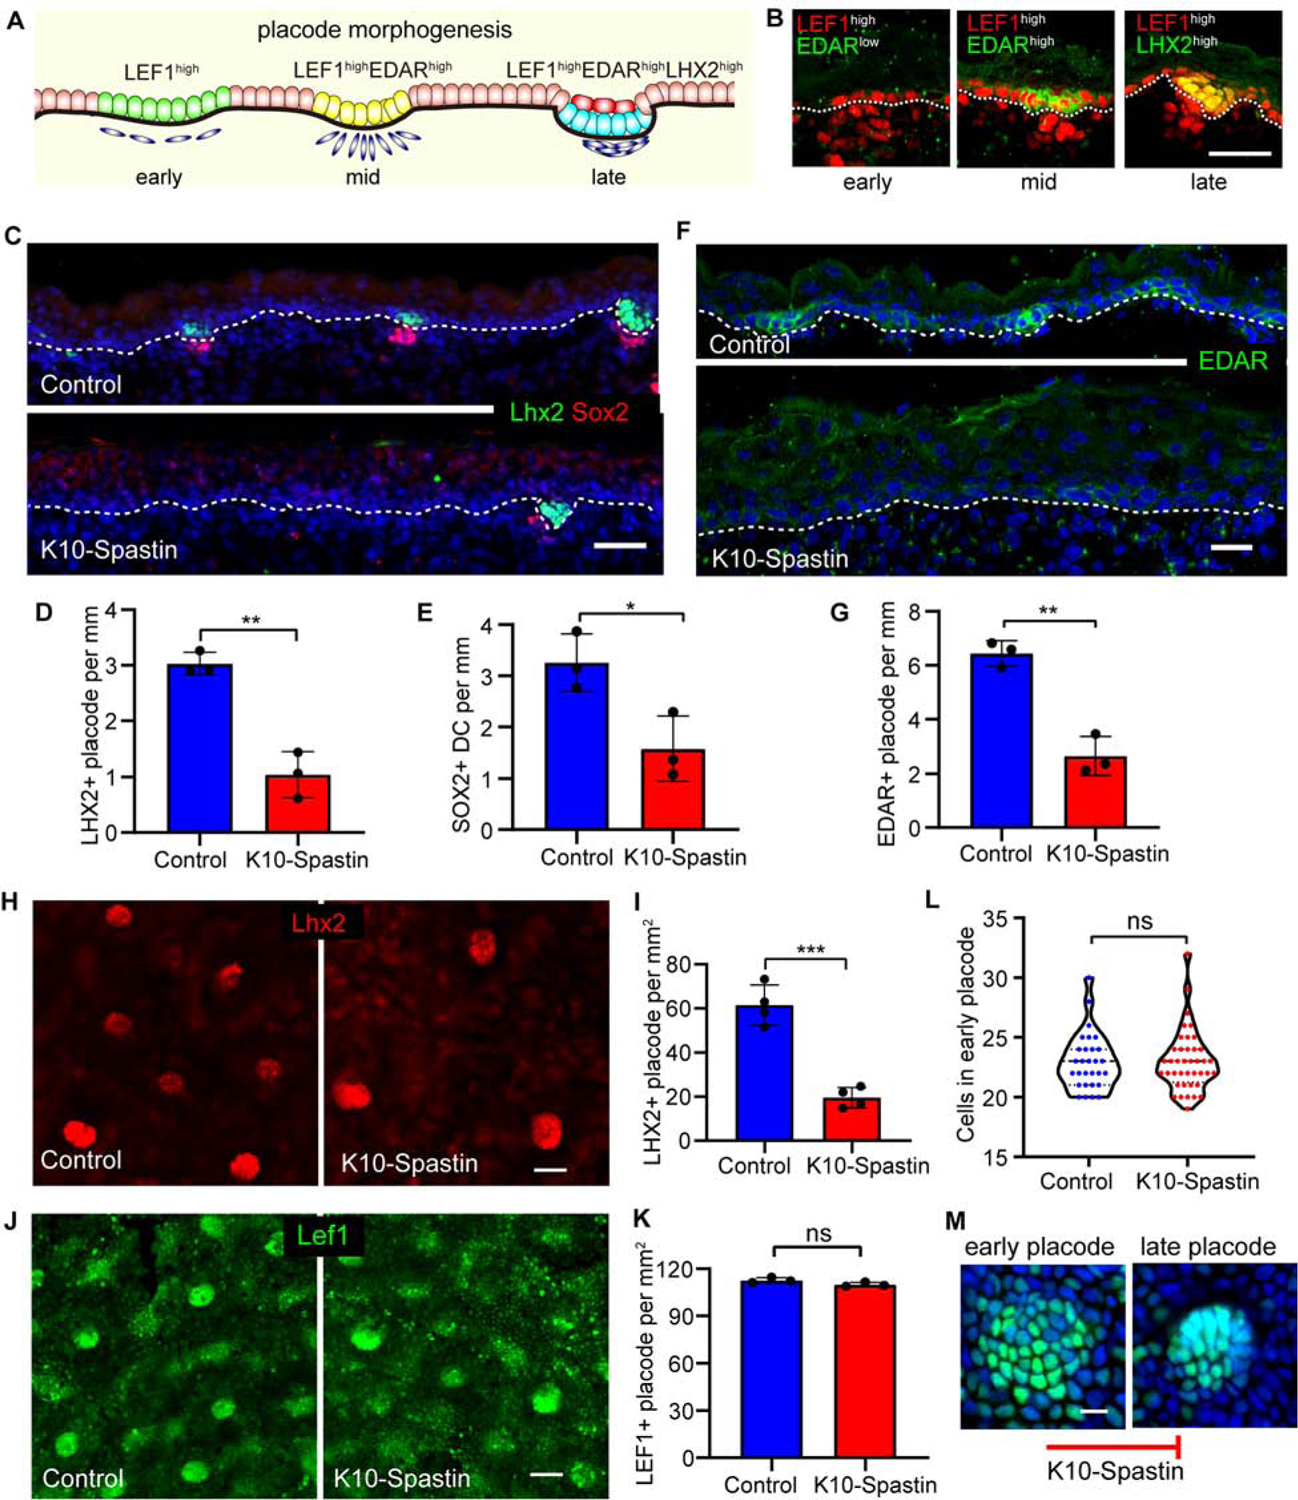
Figure 6. Increasing contractility in differentiated cells inhibits placode progression but not specification.

(A) Diagram depicting stages of hair placode morphogenesis with LEF1 (green)/EDAR (yellow)/LHX2 (cyan). Sox9 cells (red) are a suprabasal cell population that forms during placode morphogenesis.
(B) Immunostaining of Lef1high (red) early placode, EDARhigh mid placode, Lhx2high late placode at E16.5. Scale bar, 30 μm.
(C) Co-staining of Lhx2 (green) and Sox2 (red) in control and K10-Spastin skin at E16.5. Expression induced at E14.5. Scale bar, 50 μm.
(D) Quantitation of Lhx2+ placodes in control and K10-Spastin E16.5 embryos. The data source is the same as in Figure 5H. Data is mean ± SD. n=3 embryos for control (36 fields) and K10-Spastin (46 fields), p-value<0.01, two-tailed unpaired t-test.
(E) Quantification of Sox2+ dermal condensates (DC) in control and K10-Spastin embryos. Data is mean ± SD, n=3 embryos for control (36 fields) and K10-Spastin (41 fields), p-value=0.0266, two-tailed unpaired t-test.
(F and G) Decreased numbers of EDAR+ placodes in K10-Spastin compared to control at E16.5. Expression was induced at E14.5. Scale bar, 20 μm. Data is mean ± SD, n=3 embryos for control (51 fields) and for K10-Spastin (61 fields), p-value<0.01, two-tailed unpaired t-test.
(H and I) Decreased Lhx2+ placodes in K10-Spastin compared to control by whole mount staining of the epidermis at E16.5. Expression induced at E14.5. Scale bar, 40 μm. Data is mean ± SD, n=4 embryos for control (27 fields) and for K10-Spastin (28 fields), p-value<0.001, two-tailed unpaired t-test.
(J and K) Quantification of LEF1+ placodes (including early and late placode stages) in control and K10-Spastin embryos at E16.5. Expression was induced at E14.5. Scale bar, 40 μm. Data is mean ± SD, n=3 embryos for control (13 fields) and K10-Spastin (19 fields), p-value=0.1054 (>0.05, not significant), two-tailed unpaired t-test.
(L) Quantification of LEF1+ cell numbers in early placodes of control and K10-Spastin embryos at E16.5. n=29 placodes for control and n=40 placodes for K10-Spastin from 3 embryos, p-value=0.9546 (>0.05, not significant), two-tailed unpaired t-test.
(M) Images of LEF1-labeled early and late placode, the progression of which is blocked in K10-Spastin embryos. Scale bar, 10 μm.
