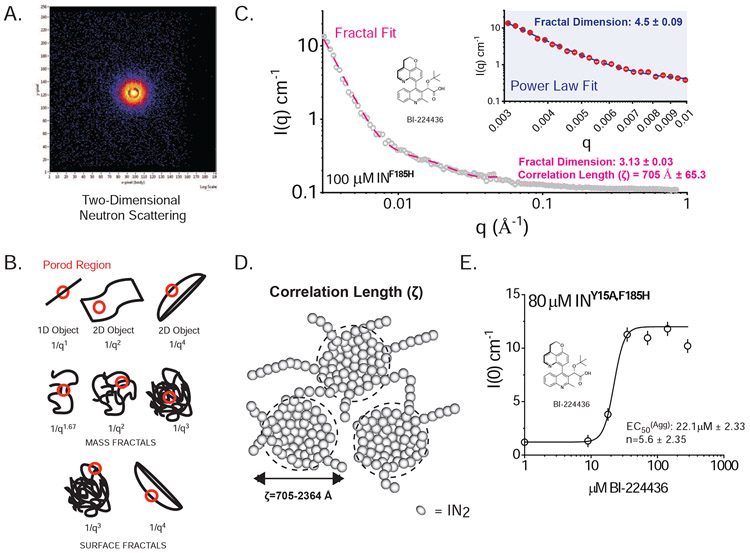
Figure 4. SANS Analysis of ALLINI-induced aggregates of HIV IN.
A. Two-dimensional Neutron Scattering of BI-224436-induced aggregates of HIV-1 INF185H. B. Porod Models for Polymer Networks with different shapes. The slope of the Porod region can be directly related to different surface and mass fractal dimensions. For mass fractals, a lower figure correlates with Gaussian chains where larger figures indicate collapsed polymer coils; values of 3-4 indicated branched systems (gels). For surface fractals, values between 3-4 indicate rough interfaces. C. Representative small-angle neutron scattering (SANS) of BI-224436 induced drug aggregate of HIV INF185H. Shown in grey is the experimental data where 0.003 A−1 < q < 0.84 Å−1. Shown in inset is a Power law fit to data obtained from 100 μM INF185H-BI-224436, in the range where 0.003 < q < 0.01 Å−1. Shown in the main plot is the same data, fit with a Fractal model in the range where 0.003 < q < 0.05 Å−1. A summary of the parameters derived from model fitting of SANS data can be found in STable 1. D. Schematic representation of the mesoscopic structure of the network formed by the ALLINI-mediated branched polymers of HIV IN, where ζ is the correlation length obtained from SANS data at 20°C. The small spheres are a simplified view of the basic units of the network backbone (IN dimers). The scattering centers (grey circles) are formed by regions of clustered protein that give rise to the scattering curves presented. The properties derived from SANS of INY15A,F185H in the absence of drug are provided in STable 2. E. Dose-response curve for the drug-induced aggregation of 80 μM HIV INY15A,F185H. Each data point represents one recorded SANS profile. Using the zero-angle intensity from each experiment, a dose-response curve could be obtained, revealing the concentration for half-maximal aggregation (EC50). The data were fit with a standard Hill equation, yielding an apparent EC50 of 22.1 μM ± 2.33 and a cooperativity factor of 5.6 ± 2.35. Error bars shown on the graph represent the error associated with the determination of I(0).

