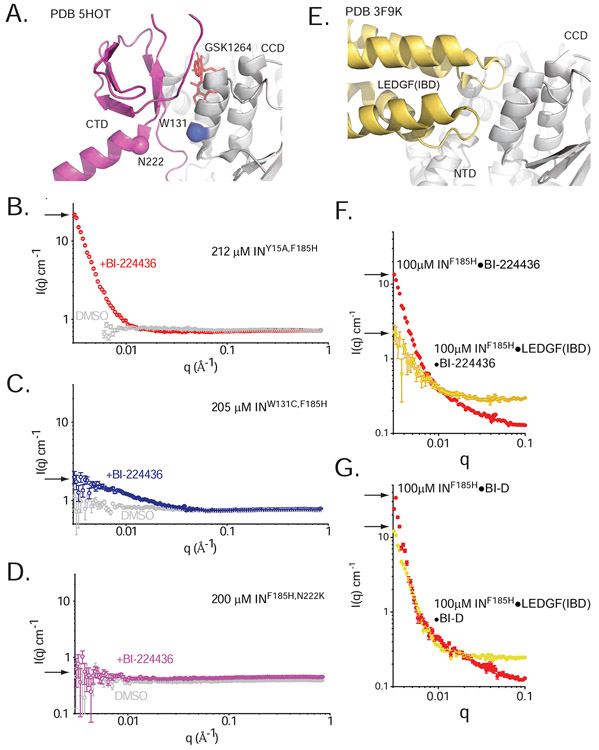
Figure 5. Effects of ex vivo resistance mutations and host factors on drug-induced aggregation.
A. W131C and N222K at the CCD-CTD-ALLINI interface. B-D. Small-angle neutron scattering profiles for 212 μM INY15A,F185H (B, red), 205 μM inW131C,F185H (C, blue), and 200 μM INF185H,N222K (D, pink) in the presence and absence of BI-224436 (DMSO controls are shown in grey). Arrows indicate I(0) in each condition. E. The LEDGF(IBD)•CCD•NTD interface, as seen in the PDB 3F9K HIV-2 structure. F-G. SANS profiles for 100 μM INF185H or 100 μM co-expressed INF185H•LEDGF(IBD) in the presence of 100 μM BI-224436 (F) or 100 μM BI-D (G). Arrows indicate I(0) in each condition.

