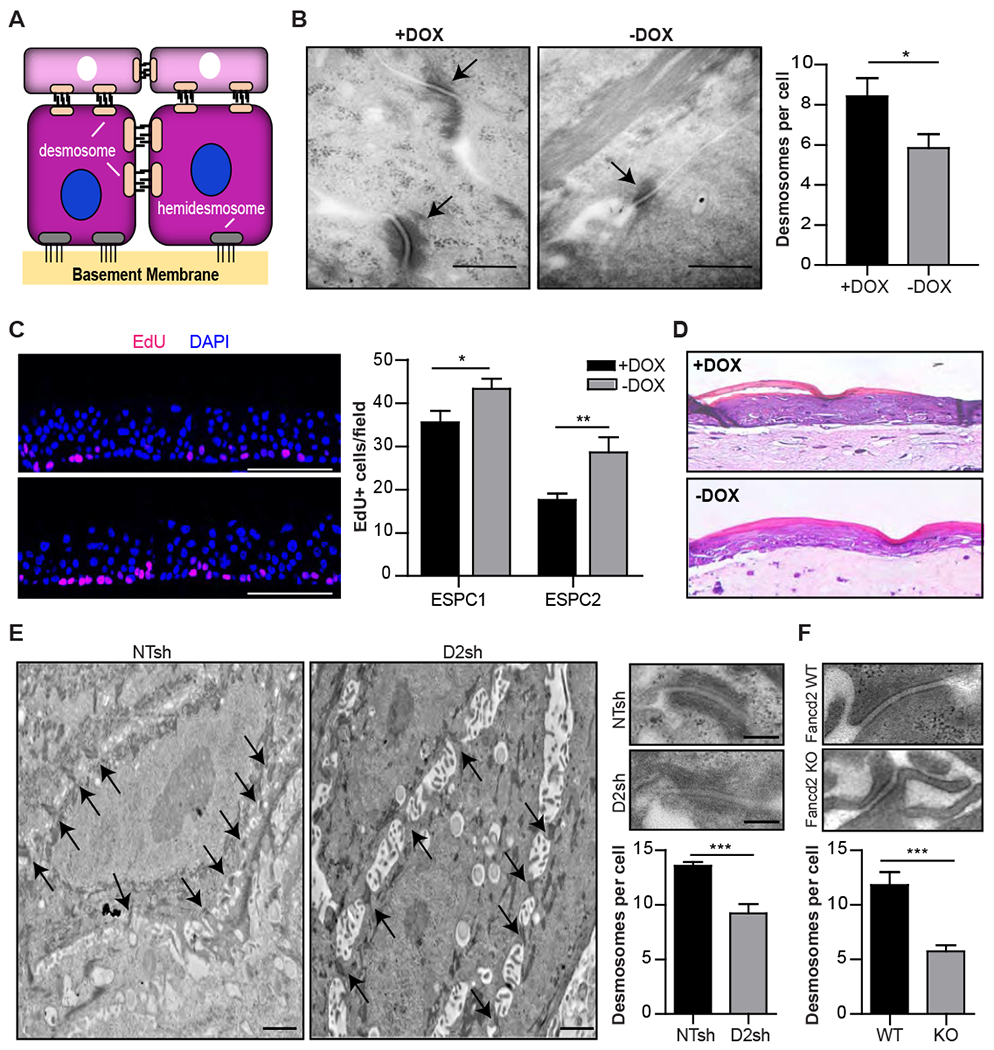
Figure 3. Cell junctional defects and increased proliferation in the FA epidermis.

(A) Schematic representation showing cell-cell desmosome and cell-basal lamina hemidesmosome junctions on basal keratinocytes. (B) Sections from 3D +/−DOX PSC-EORs were used for EM. Images and quantification of desmosomes per cell are shown; n=3, *P=0.03. Arrows: desmosomes. Scale bar, 500 nm. Error bars represent SEM. (C) Quantification of EdU+ cells in engineered epidermis generated from +/−DOX ESPC1 and ESPC2 cell populations; n=2 biological replicates for ESPC1, n=2 technical replicates for ESPC2. *P=0.04 (ESPC1) and **P=0.0091 (ESPC2). Scale bar, 100 μm. Error bars represent SEM. (D) H&E staining showing normal overall architecture on FA-ESPCs-derived engineered epidermis cultured in presence or absence of DOX; representative images are shown. Magnification, 40x. (E) EM images and quantification of desmosomes present per cell on 3D epidermis derived from NTsh or FANCD2sh NIKS. Magnified insets show the representative structure of one desmosome; n=3. Scale bars, 2 μm and 250 nm (insets). ***P=0.0002. Error bars represent SEM. (F) Representative structure and quantification of desmosomes present per cell in tongues from Fancd2 WT (WT) and Fancd2 KO (KO) mice; n=2. ***P<0.0001. Error bars represent SEM. See also Figure S3.
