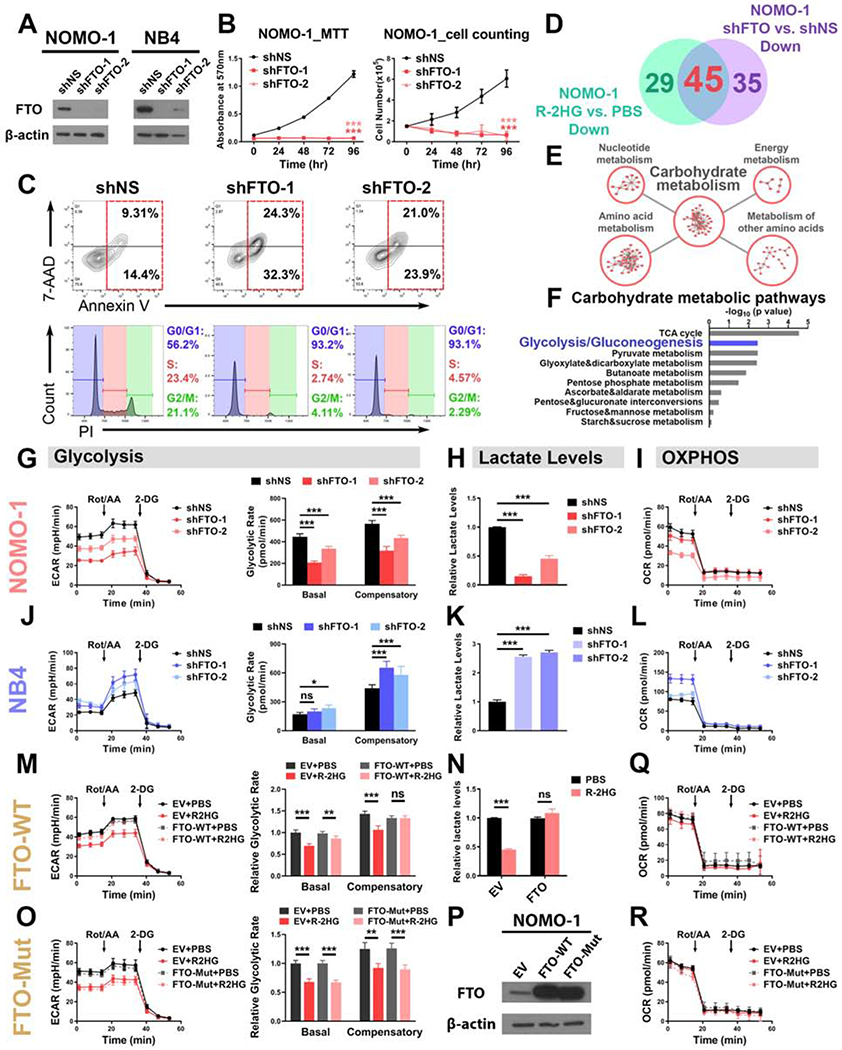
Figure 3. FTO mediates the glycolytic inhibitory effect of R-2HG in sensitive leukemia cells.

(A) Verification of FTO KD efficiency in NOMO-1 and NB4 cells.
(B) FTO KD in NOMO-1 cells inhibited cell proliferation/growth, as determined by MTT (left panel) and cell counting (right panel) assays.
(C) Effects of FTO KD on apoptosis (upper panel) and cell cycle (lower panel) in NOMO-1 cells.
(D) Venn diagram showing numbers of metabolites downregulated in NOMO-1 cells upon R-2HG treatment and FTO KD.
(E) The top 5 enriched KEGG metabolic pathway classes detected by the pathway enrichment analysis of the shared downregulated metabolites.
(F) List of the top 10 enriched carbohydrate metabolic pathways.
(G-I) Effects of FTO KD on glycolytic rates (G), lactate levels (H), and mitochondrial respiration (I) in NOMO-1 cells.
(J-L) Effects of FTO KD on glycolytic rates (J), lactate levels (K), and mitochondrial respiration (L) in NB4 cells.
(M and N) Overexpression of wild-type FTO rescued the glycolytic rates (M) and lactate levels(N) in 50 μM R-2HG-treated NOMO-1 cells.
(O) Overexpression of catalytic-dead FTO failed to rescue the glycolytic inhibition induced by R-2HG (50 μM) in NOMO-1 cells.
(P) Confirmation of wild-type and catalytic-dead FTO overexpression efficiency. EV: empty vector.
(Q and R) Effects of wild-type (Q) and catalytic-dead (R) FTO on mitochondrial respiration in NOMO-1 cells with and without R-2HG (50 μM) treatment.
Data are represented as mean ± SD. ns, not significant (p ≥ 0.05); *, p < 0.05; **, p < 0.01; ***, p < 0.001.
