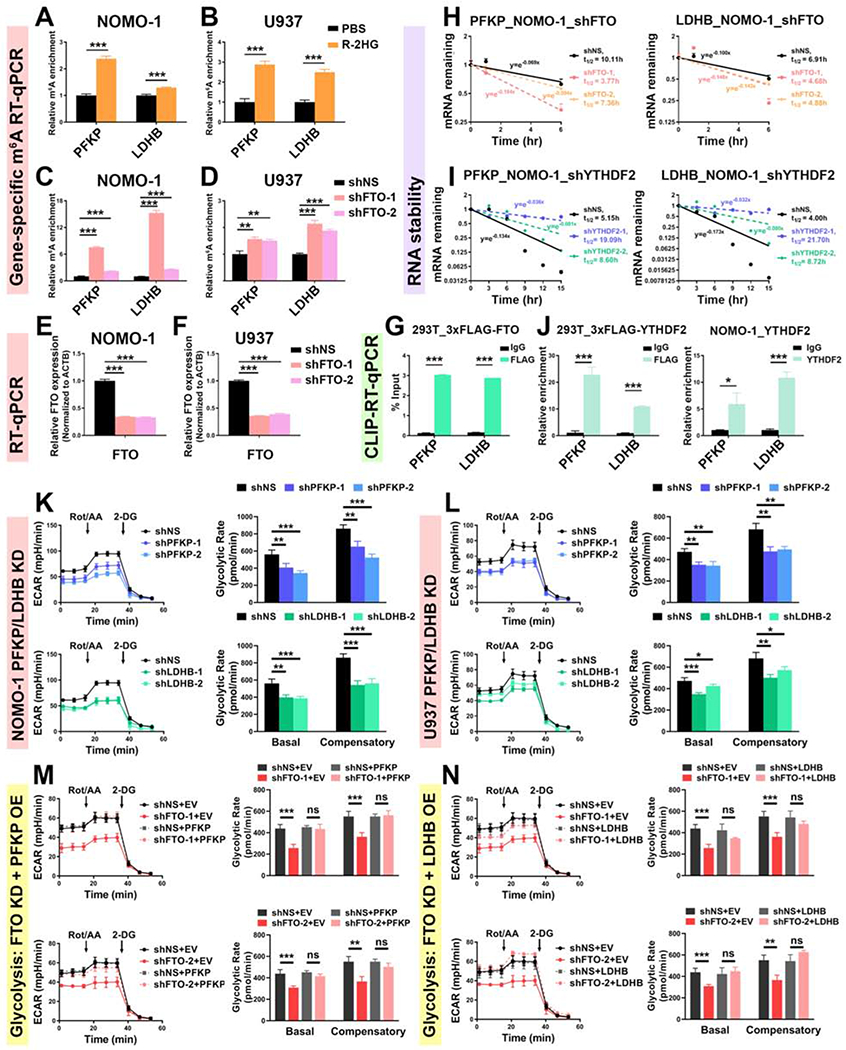
Figure 5. Expression of PFKP and LDHB is downregulated by the R-2HG/FTO axis via an m6A-dependent mechanism.

(A and B) Relative m6A abundance in PFKP and LDHB transcripts in NOMO-1 (A) and U937 (B) cells upon 300 μM R-2HG for 48 h.
(C and D) The m6A abundance changes in PFKP and LDHB transcripts in NOMO-1 (C) and U937 (D) cells upon FTO KD.
(E and F) Verification of FTO KD efficiency in NOMO-1 (E) and U937 (F) cells.
(G) Determination of the direct binding of FTO with PFKP and LDHB transcripts.
(H and I) Effects of FTO (H) and YTHDF2 (I) KD on the stability of PFKP (left panel) and LDHB (right panel) mRNAs.
(J) Determination of the direct binding of YTHDF2 with PFKP and LDHB transcripts in 293T (left panel) and NOMO-1 (right panel) cells.
(K and L) Effects of PFKP (upper panel) and LDHB (lower panel) KD on glycolytic rates in NOMO-1 (K) and U937 (L) cells. The same control shNS groups were used for the analysis.
(M and N) FTO KD-induced glycolytic inhibition by either shFTO-1 (upper panel) or shFTO-2 (lower panel) could be rescued by forced expression of PFKP (M) or LDHB (N). The same control groups (shNS+EV, shNS+PFKP, and shNS+LDHB) were used for the analysis.
Data are represented as mean ± SD. ns, not significant (p ≥ 0.05); *, p < 0.05; **, p < 0.01; ***, p < 0.001.
See also Figure S5.
