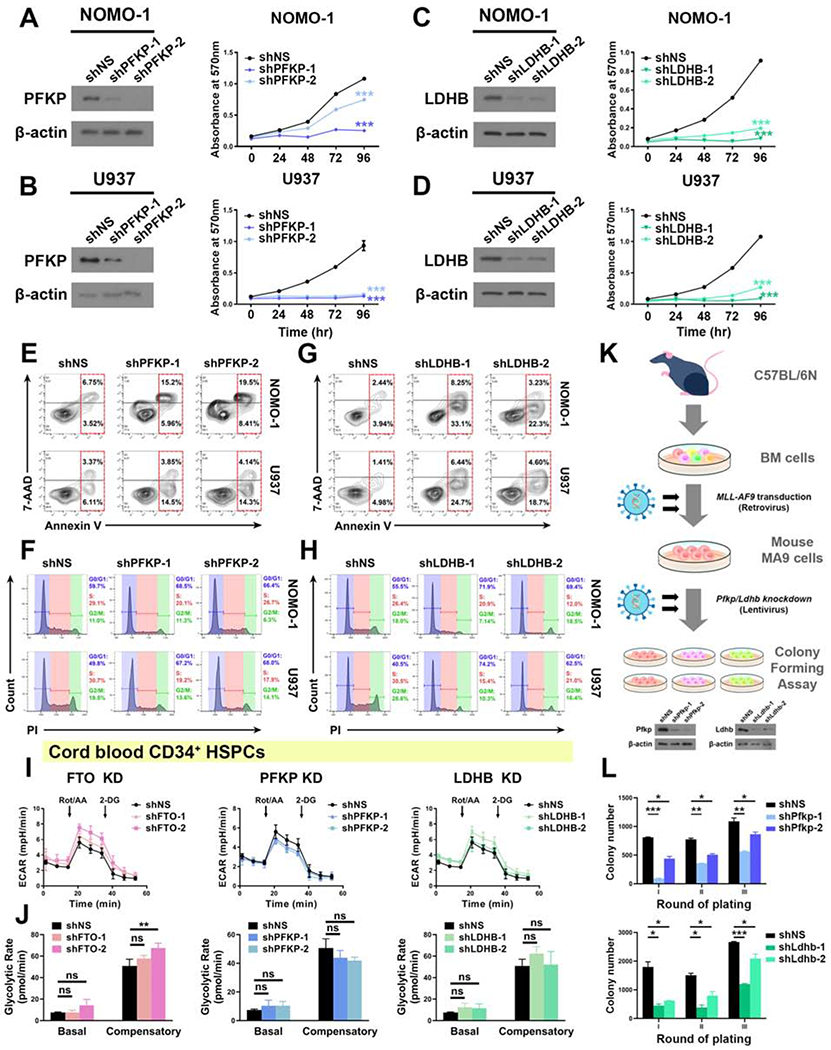
Figure 6. Effects of PFKP or LDHB KD in leukemia cells and normal CD34+ HSPCs.

(A and B) Effects of KD of PFKP (left panel) on cell proliferation/growth (right panel) in NOMO-1 (A) and U937 (B) cells.
(C and D) Effects of KD of LDHB (left panel) on cell proliferation/growth (right panel) in NOMO-1 (C) and U937 (D) cells.
(E and F) Effects of PFKP KD on apoptosis (E) and cell cycle (F) in NOMO-1 and U937 cells.
(G and H) Effects of LDHB KD on apoptosis (G) and cell cycle (H) in NOMO-1 and U937 cells.
(I and J) Effects of KD of FTO (left panel), PFKP (middle panel), and LDHB (right panel) on glycolytic rates in normal CD34+ HSPCs. The same control shNS group was used for the analysis.
(K) Schematic illustration of mouse MA9 cell colony forming assay.
(L) Effects of Pfkp (upper panel) or Ldhb (lower panel) KD on colony forming/replating capacity of mouse MA9 cells.
Data are represented as mean ± SD. ns, not significant (p ≥ 0.05); *, p < 0.05; **, p < 0.01; ***, p < 0.001.
See also Figure S6.
