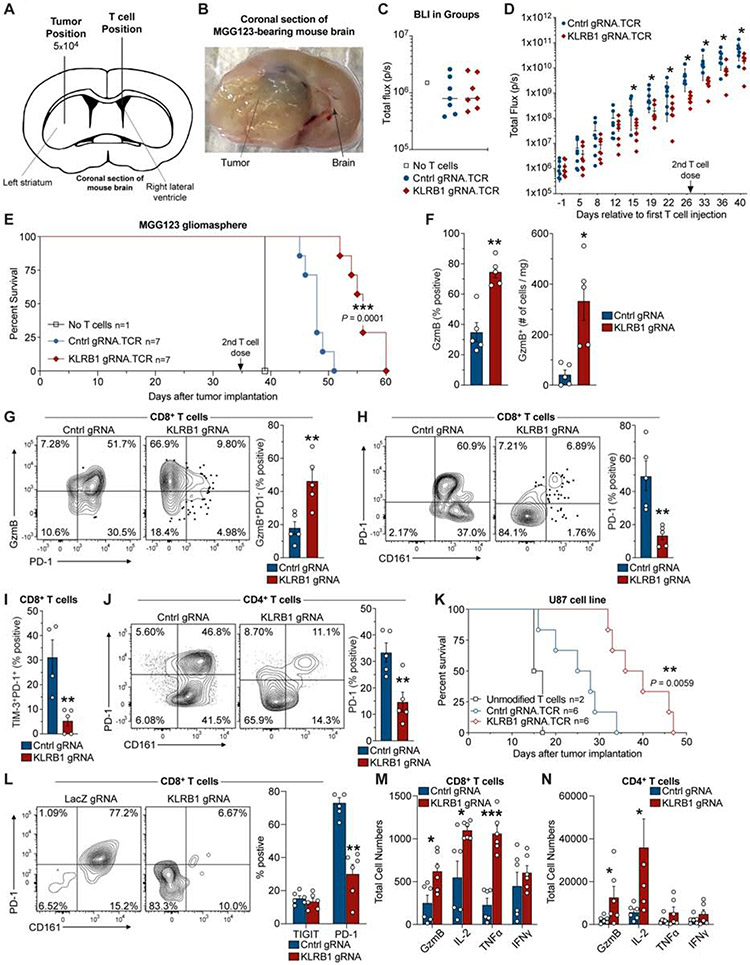
Fig. 6. KLRB1 gene inactivation in T cells improves survival in two humanized GBM models.
(A) Schematic indicating injection sites of GBM cells into the striatum and T cells into the contralateral lateral ventricle. (B) Coronal section of the mouse brain at survival endpoint. (C) Bioluminescence imaging (BLI) on day −1 (relative to first T cell injection). (D) Kinetic analysis of tumor burden based on BLI signal from mice that received KLRB1 or control edited T cells; day 0 corresponds to first T cell injection; 2nd T cell injection is indicated. (E) Survival analysis for MGG123 model following transfer of KLRB1 or control edited T cells. (F-J) Flow cytometry analysis of KLRB1 or control edited T cells infiltrating MGG123 at a late disease stage (moribund). (K) Survival analysis for U87 model following transfer of KLRB1 or control edited T cells. (L-N) Flow cytometry analysis of T cells from U-87 MG tumors 8 days following T cell injection. Experiments in (C-E) & (K) were performed twice; (F-J) and (L-N) were performed once. * P < 0.05, ** P < 0.01, *** P < 0.001, error bars denote SEM. Mann-Whitney U test (D), (F-J), (L-N) and Log-rank (Mantel-Cox) test (E), (K).

