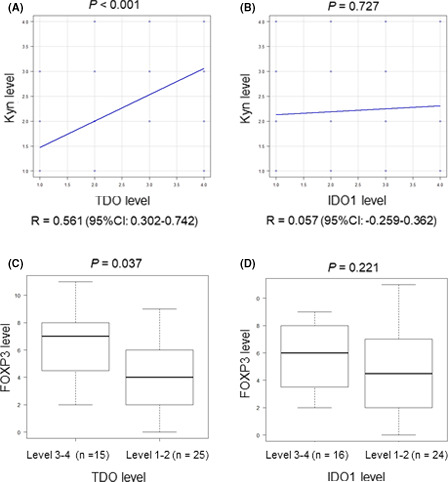
FIGURE 4.

TDO rather than IDO1 is associated with the expression of Kyn and infiltration of FOXP3‐positive cells. Tumor tissues from 40 patients with mRCC were used to evaluate the correlation of expression of TDO, IDO1, Kyn, and FOXP3 by immunohistochemistry. Pearson's coefficient analysis showed that TDO expression levels (A), but not IDO1 expression levels (B), correlated well with Kyn expression levels. Mann‐Whitney U tests showed that FOXP3 expression levels were significantly increased in the TDO level 3‐4 group (C), but not in the IDO1 level 3‐4 group (D). CI, confidence interval; FOXP3, forkhead box P3; Kyn, kynurenine; IDO1, indoleamine 2,3‐dioxygenase 1; mRCC, metastatic RCC; TDO, tryptophan 2,3‐dioxygenase
