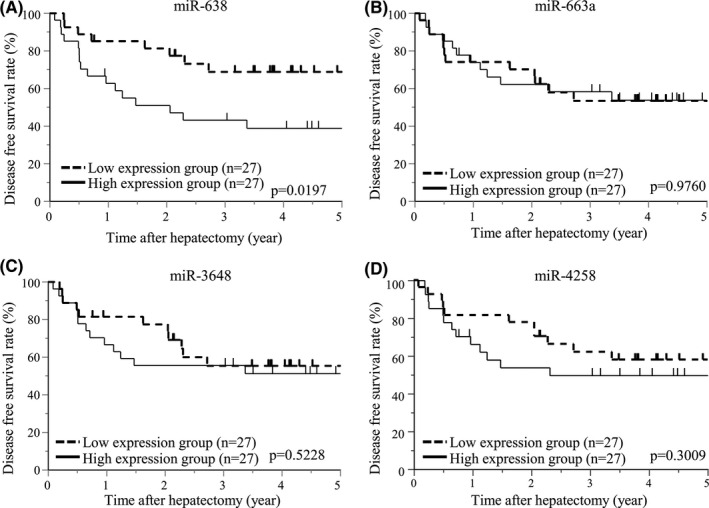
FIGURE 5.

DFS associated with levels of serum exosomal miRNA expression in HCC patients. A, DFS curves for low and high miR‐638 expression by the Kaplan‐Meier method. B, Curves for low and high miR‐663a expression. C, Curves for low and high miR‐3648 expression. D, Curves for low and high miR‐4258 expression
