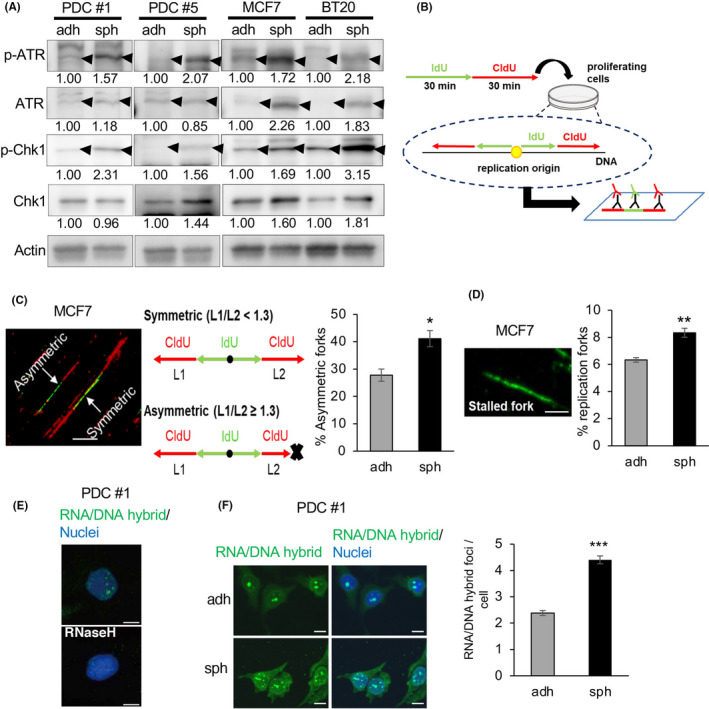
FIGURE 2.

c‐Myc expression and DNA replication stress are upregulated in CSC‐enriched spheroid cells. A, Expression levels of ATR, p‐ATR, Chk1, and p‐Chk1, determined by immunoblotting, were compared between cells cultured under the adherent and sphere conditions. Expression levels were quantified using ImageJ software and normalized to Actin. B, Schematic of the experimental procedure. Cells were incubated sequentially with iodo‐deoxyuridine (IdU) then chloro‐deoxyuridine (CldU). Labeled DNA was spread onto glass slides, and then stained with antibodies for IdU (green) and CldU (red). If replication started in the first 30 min, bidirectional forks stained with green and red could be observed. C, Proportion of asymmetric forks, representative of replication stress. The ratio of longer CldU tracks (L1) to shorter tracks (L2) was calculated; forks with L1/L2 ≥ 1.3 were regarded as asymmetric. Thirty bidirectional forks in each slide were counted. Three slides for each population were prepared (mean ± SEM, n = 3; *P < .05). Scale bar = 10 μm. D, Proportion of stalled forks, labeled only with green was calculated. In total, 200 labeled forks in each slide were counted. Three slides for each population were prepared (mean ± SEM, n = 3; **P < .01). Scale bar = 5 μm. E, Immunofluorescence images of RNA/DNA hybrid staining in PDCs are shown. Cells were cultured under the sphere condition with or without RNase H treatment. Nuclei were counterstained with DAPI. Scale bars = 10 μm. F, (Left) Immunofluorescence images of RNA/DNA hybrid staining in PDCs cultured under adherent and sphere conditions are shown. (Right) Number of RNA/DNA hybrid foci in each cell was counted and compared between the 2 conditions. In total, 100 cells in each slide were counted. Three slides for each population were prepared (mean ± SEM, n = 3; ***P < .001). Scale bars = 10 μm
