FIGURE 2.

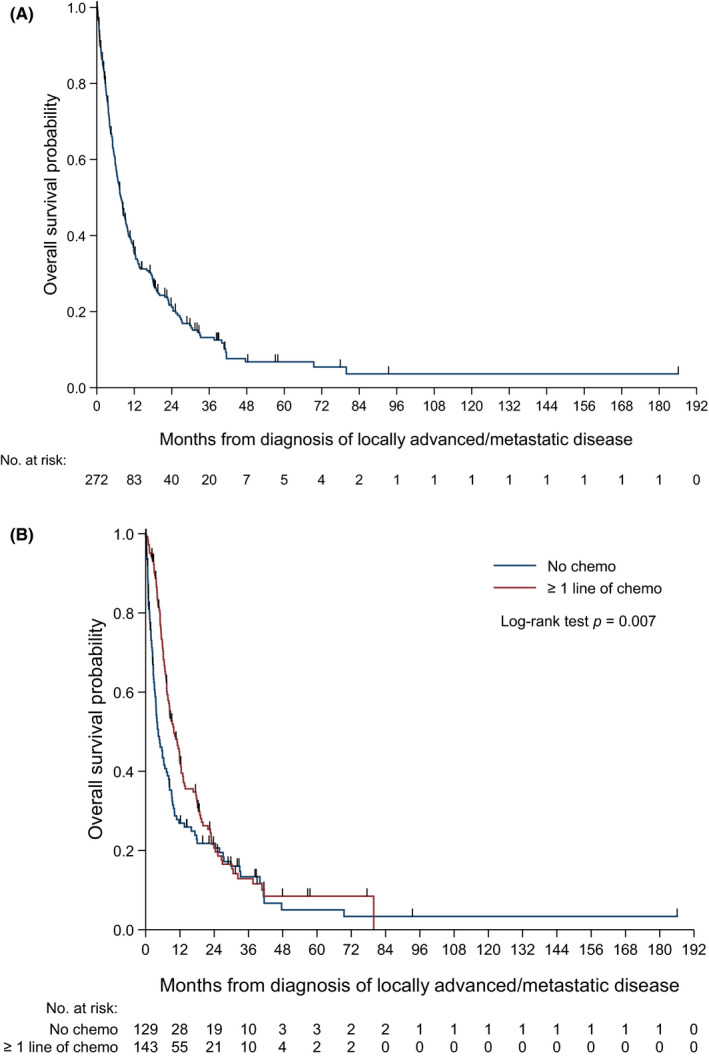
A, Overall survival Kaplan‐Meier curve of the advanced angiosarcoma cohort. B, Overall survival Kaplan‐Meier curve of those who received chemotherapy vs those who had not received chemotherapy in the advanced angiosarcoma cohort

A, Overall survival Kaplan‐Meier curve of the advanced angiosarcoma cohort. B, Overall survival Kaplan‐Meier curve of those who received chemotherapy vs those who had not received chemotherapy in the advanced angiosarcoma cohort