
FIGURE 1.
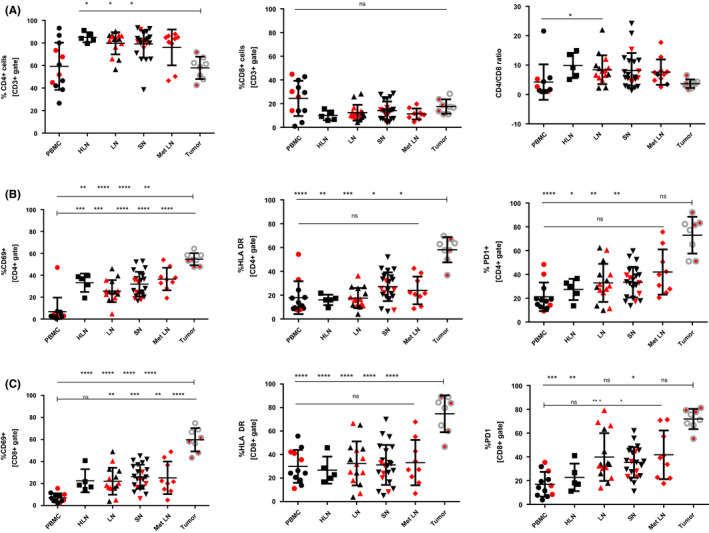
Expression of CD69, HLA‐DR, and PD1 in TDLNs and tumor in head and neck cancer patients. A, Percentage of CD4+ T cells, CD8+ T cells, and CD4/CD8 ratio among analyzed compartments. B, Expression of CD69, HLA‐DR, and PD1 within CD4+ T cells. C, Expression of CD69, HLA‐DR, and PD1 within CD8+ T cells. Red represents samples from patients with nodal metastases. *<.05, **<.01, ***<.001, **** <.0001