
FIGURE 2.
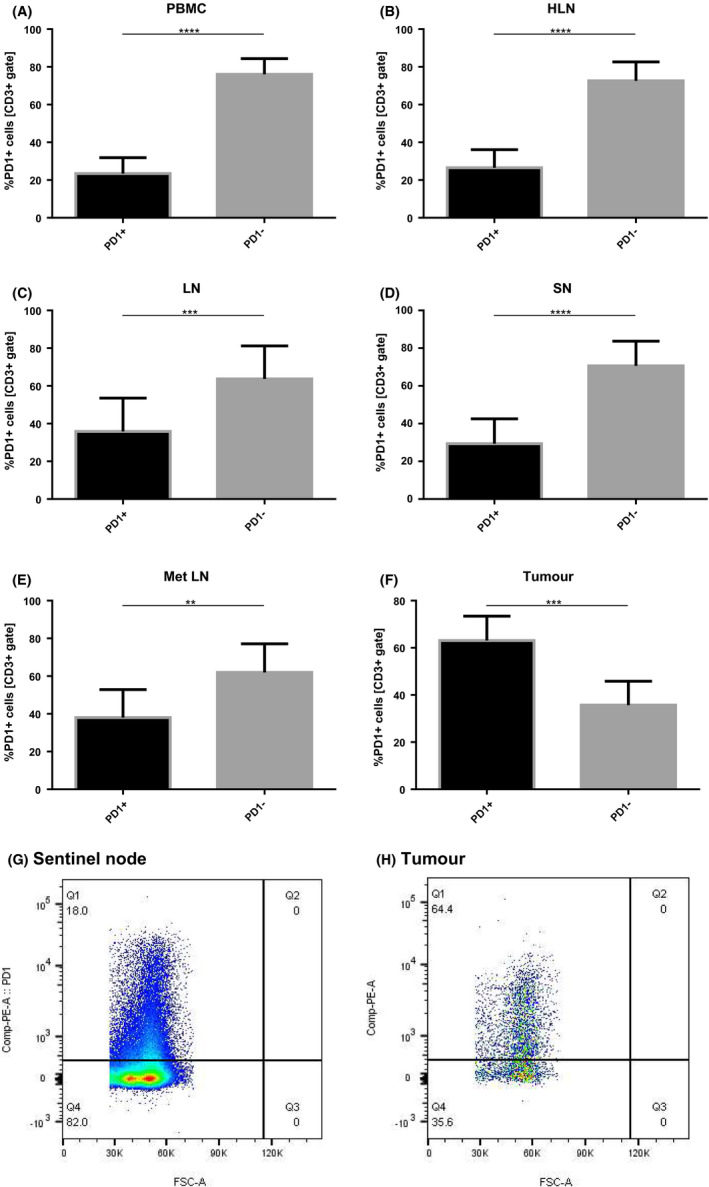
Percentage of PD1 positive CD3+ cells among PBMC, healthy LN, TDLNs and tumor samples. A–F, Percentage of PD1neg vs PD1pos cells within CD3+ compartment among analyzed locations. G, H, Scatter plots showing PD1pos populations in sentinel node and tumor, respectively. *<.05, **<.01, ***<.001, ****<0.0001